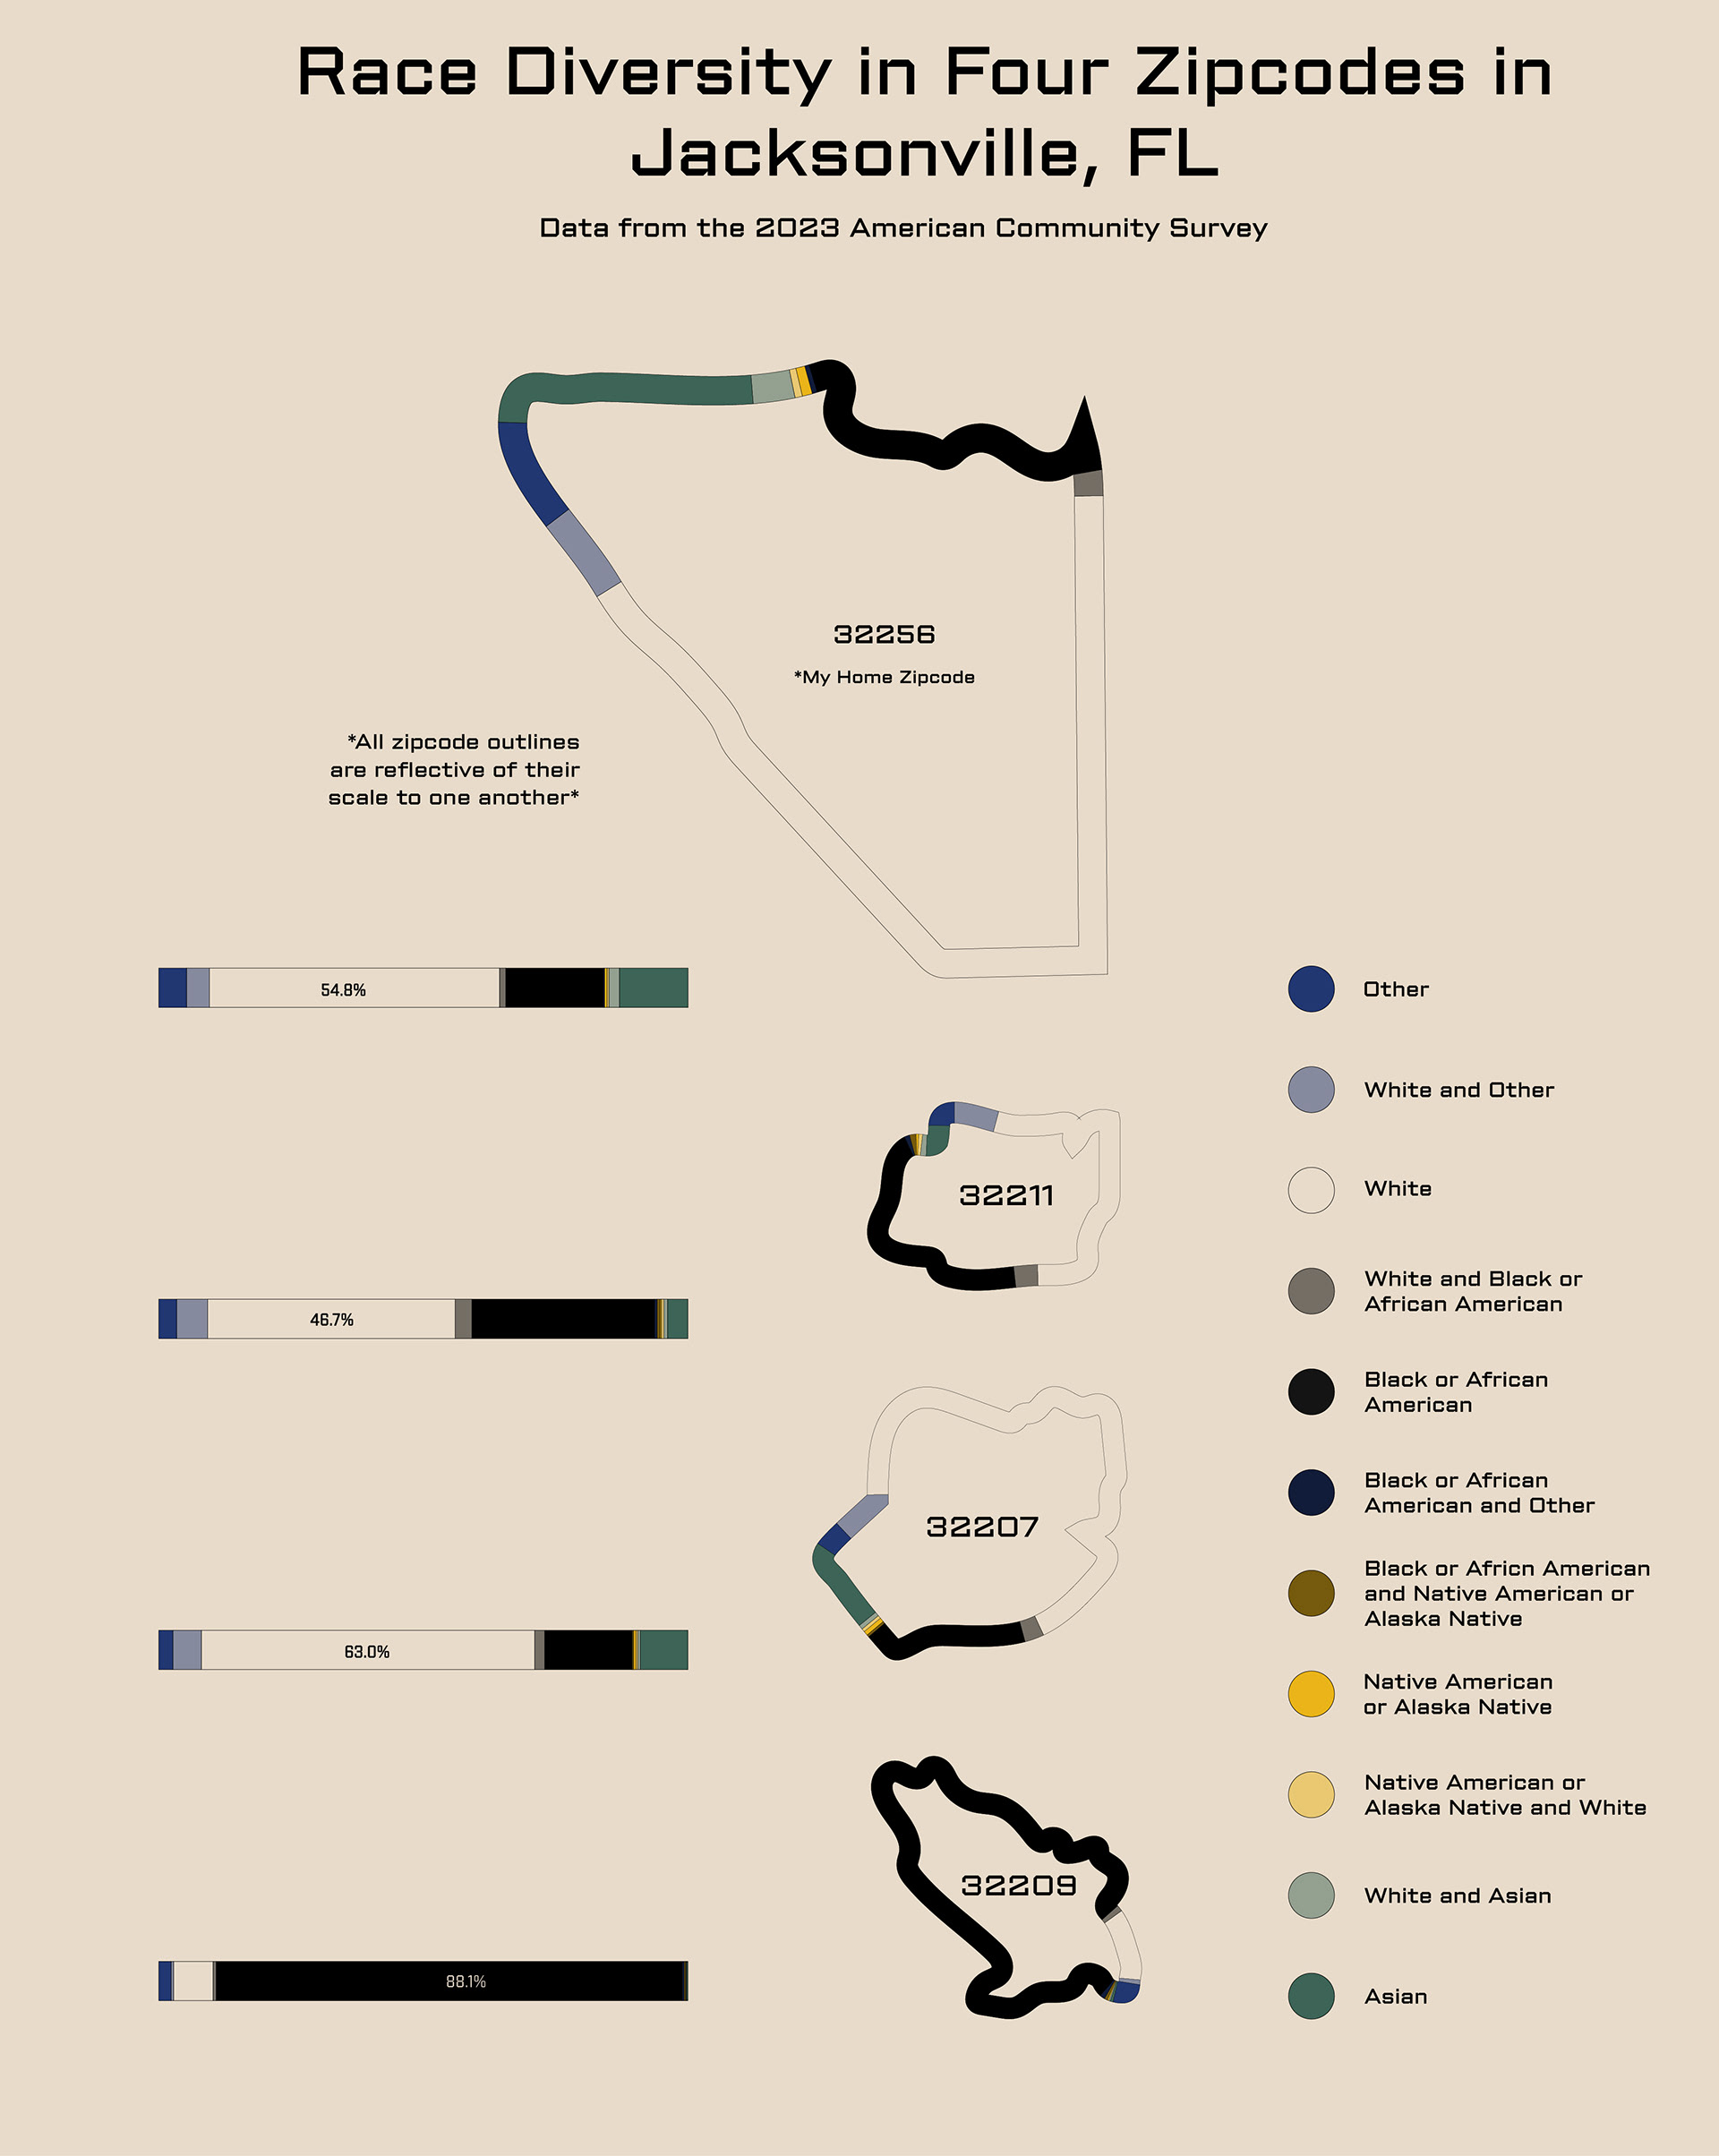
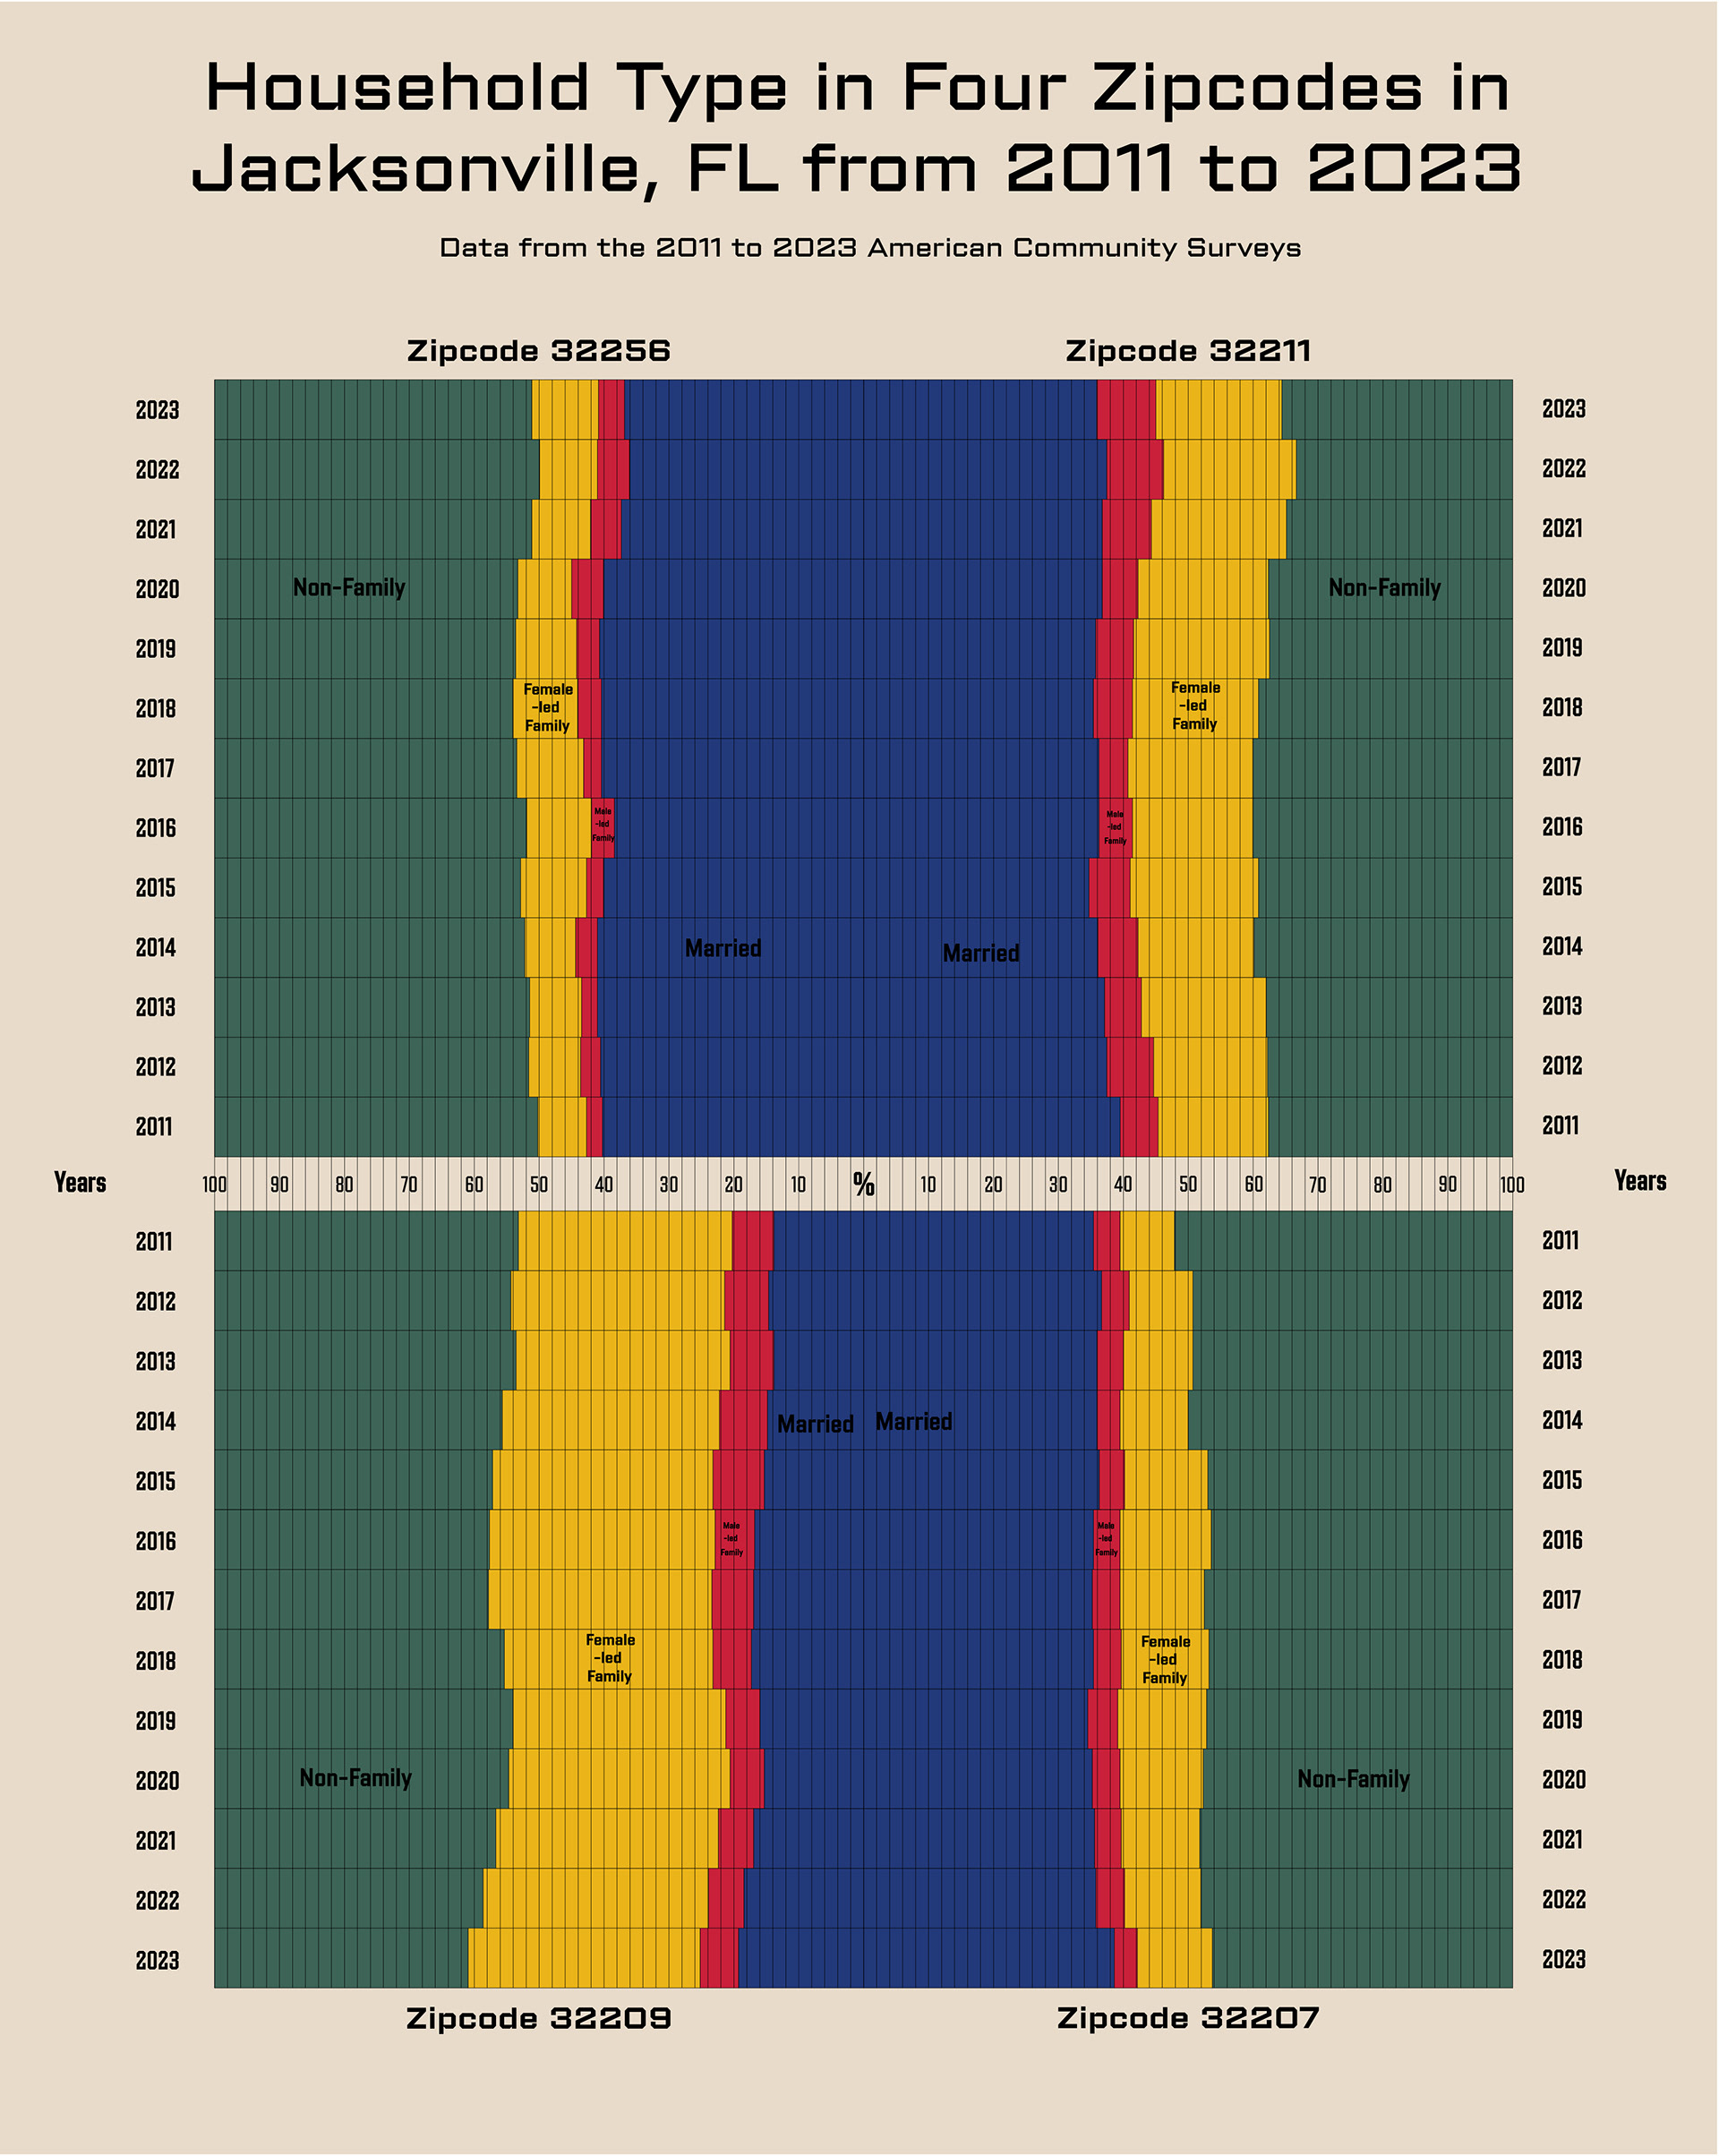
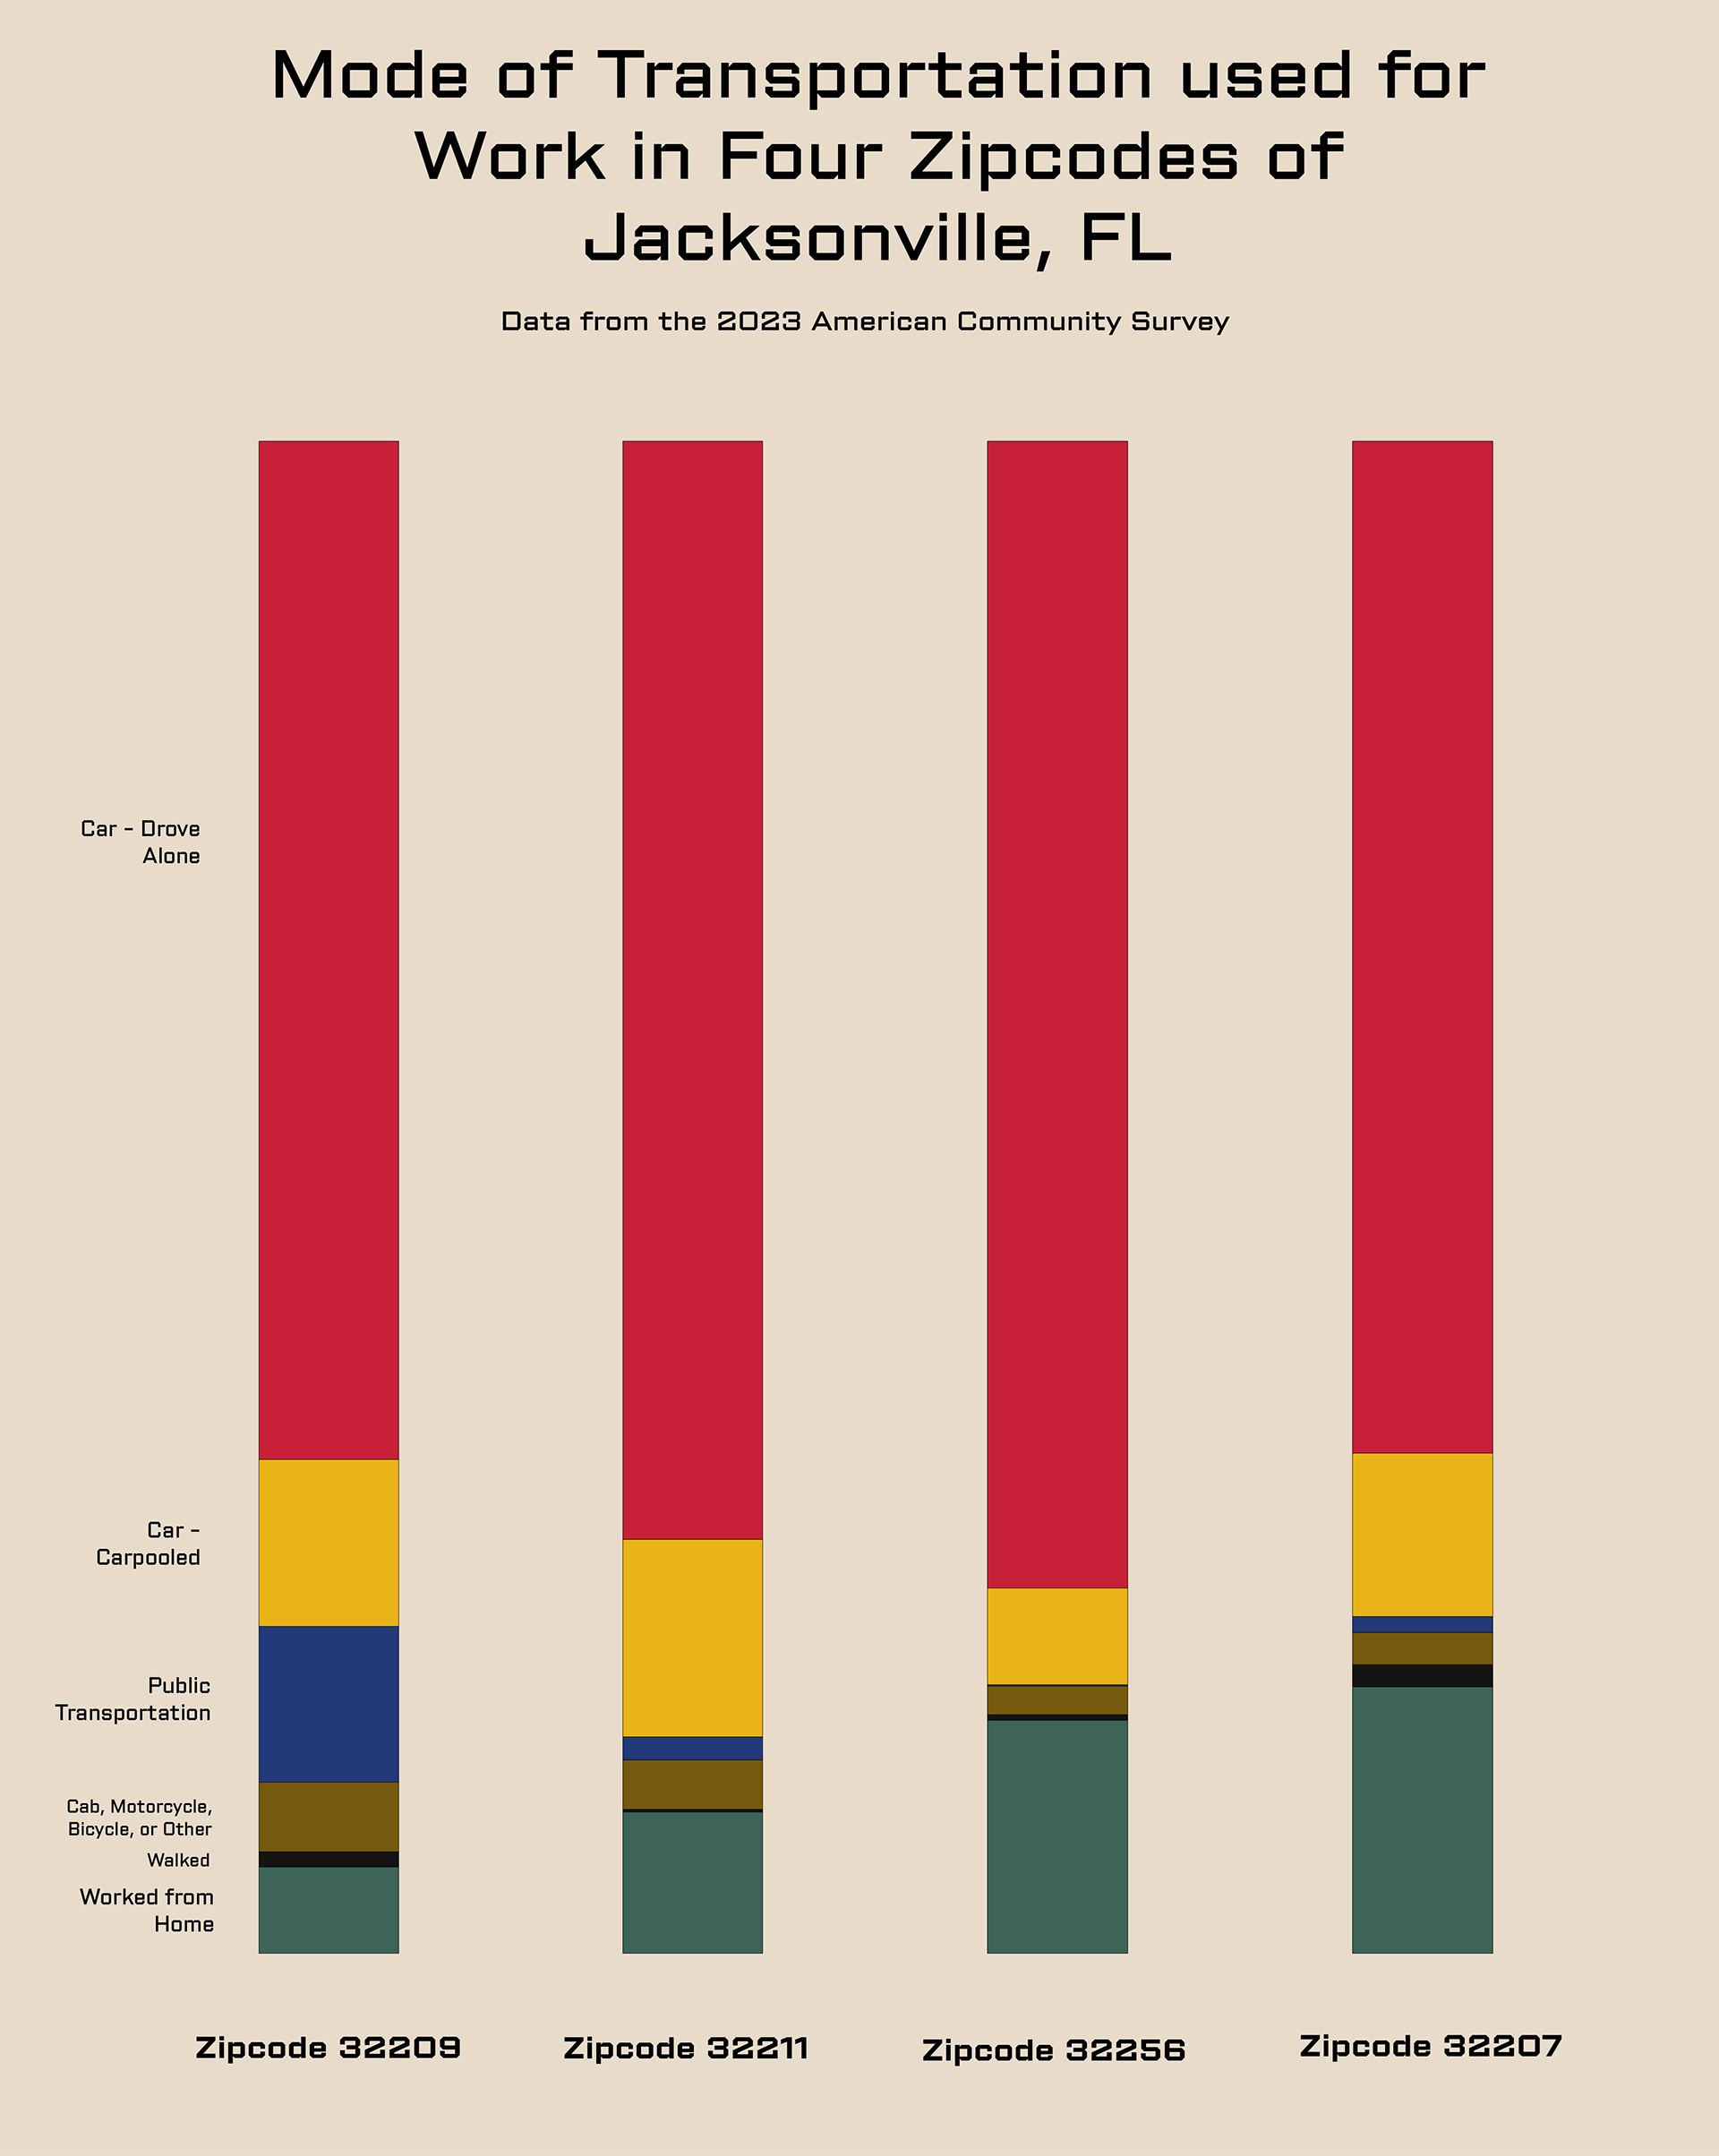
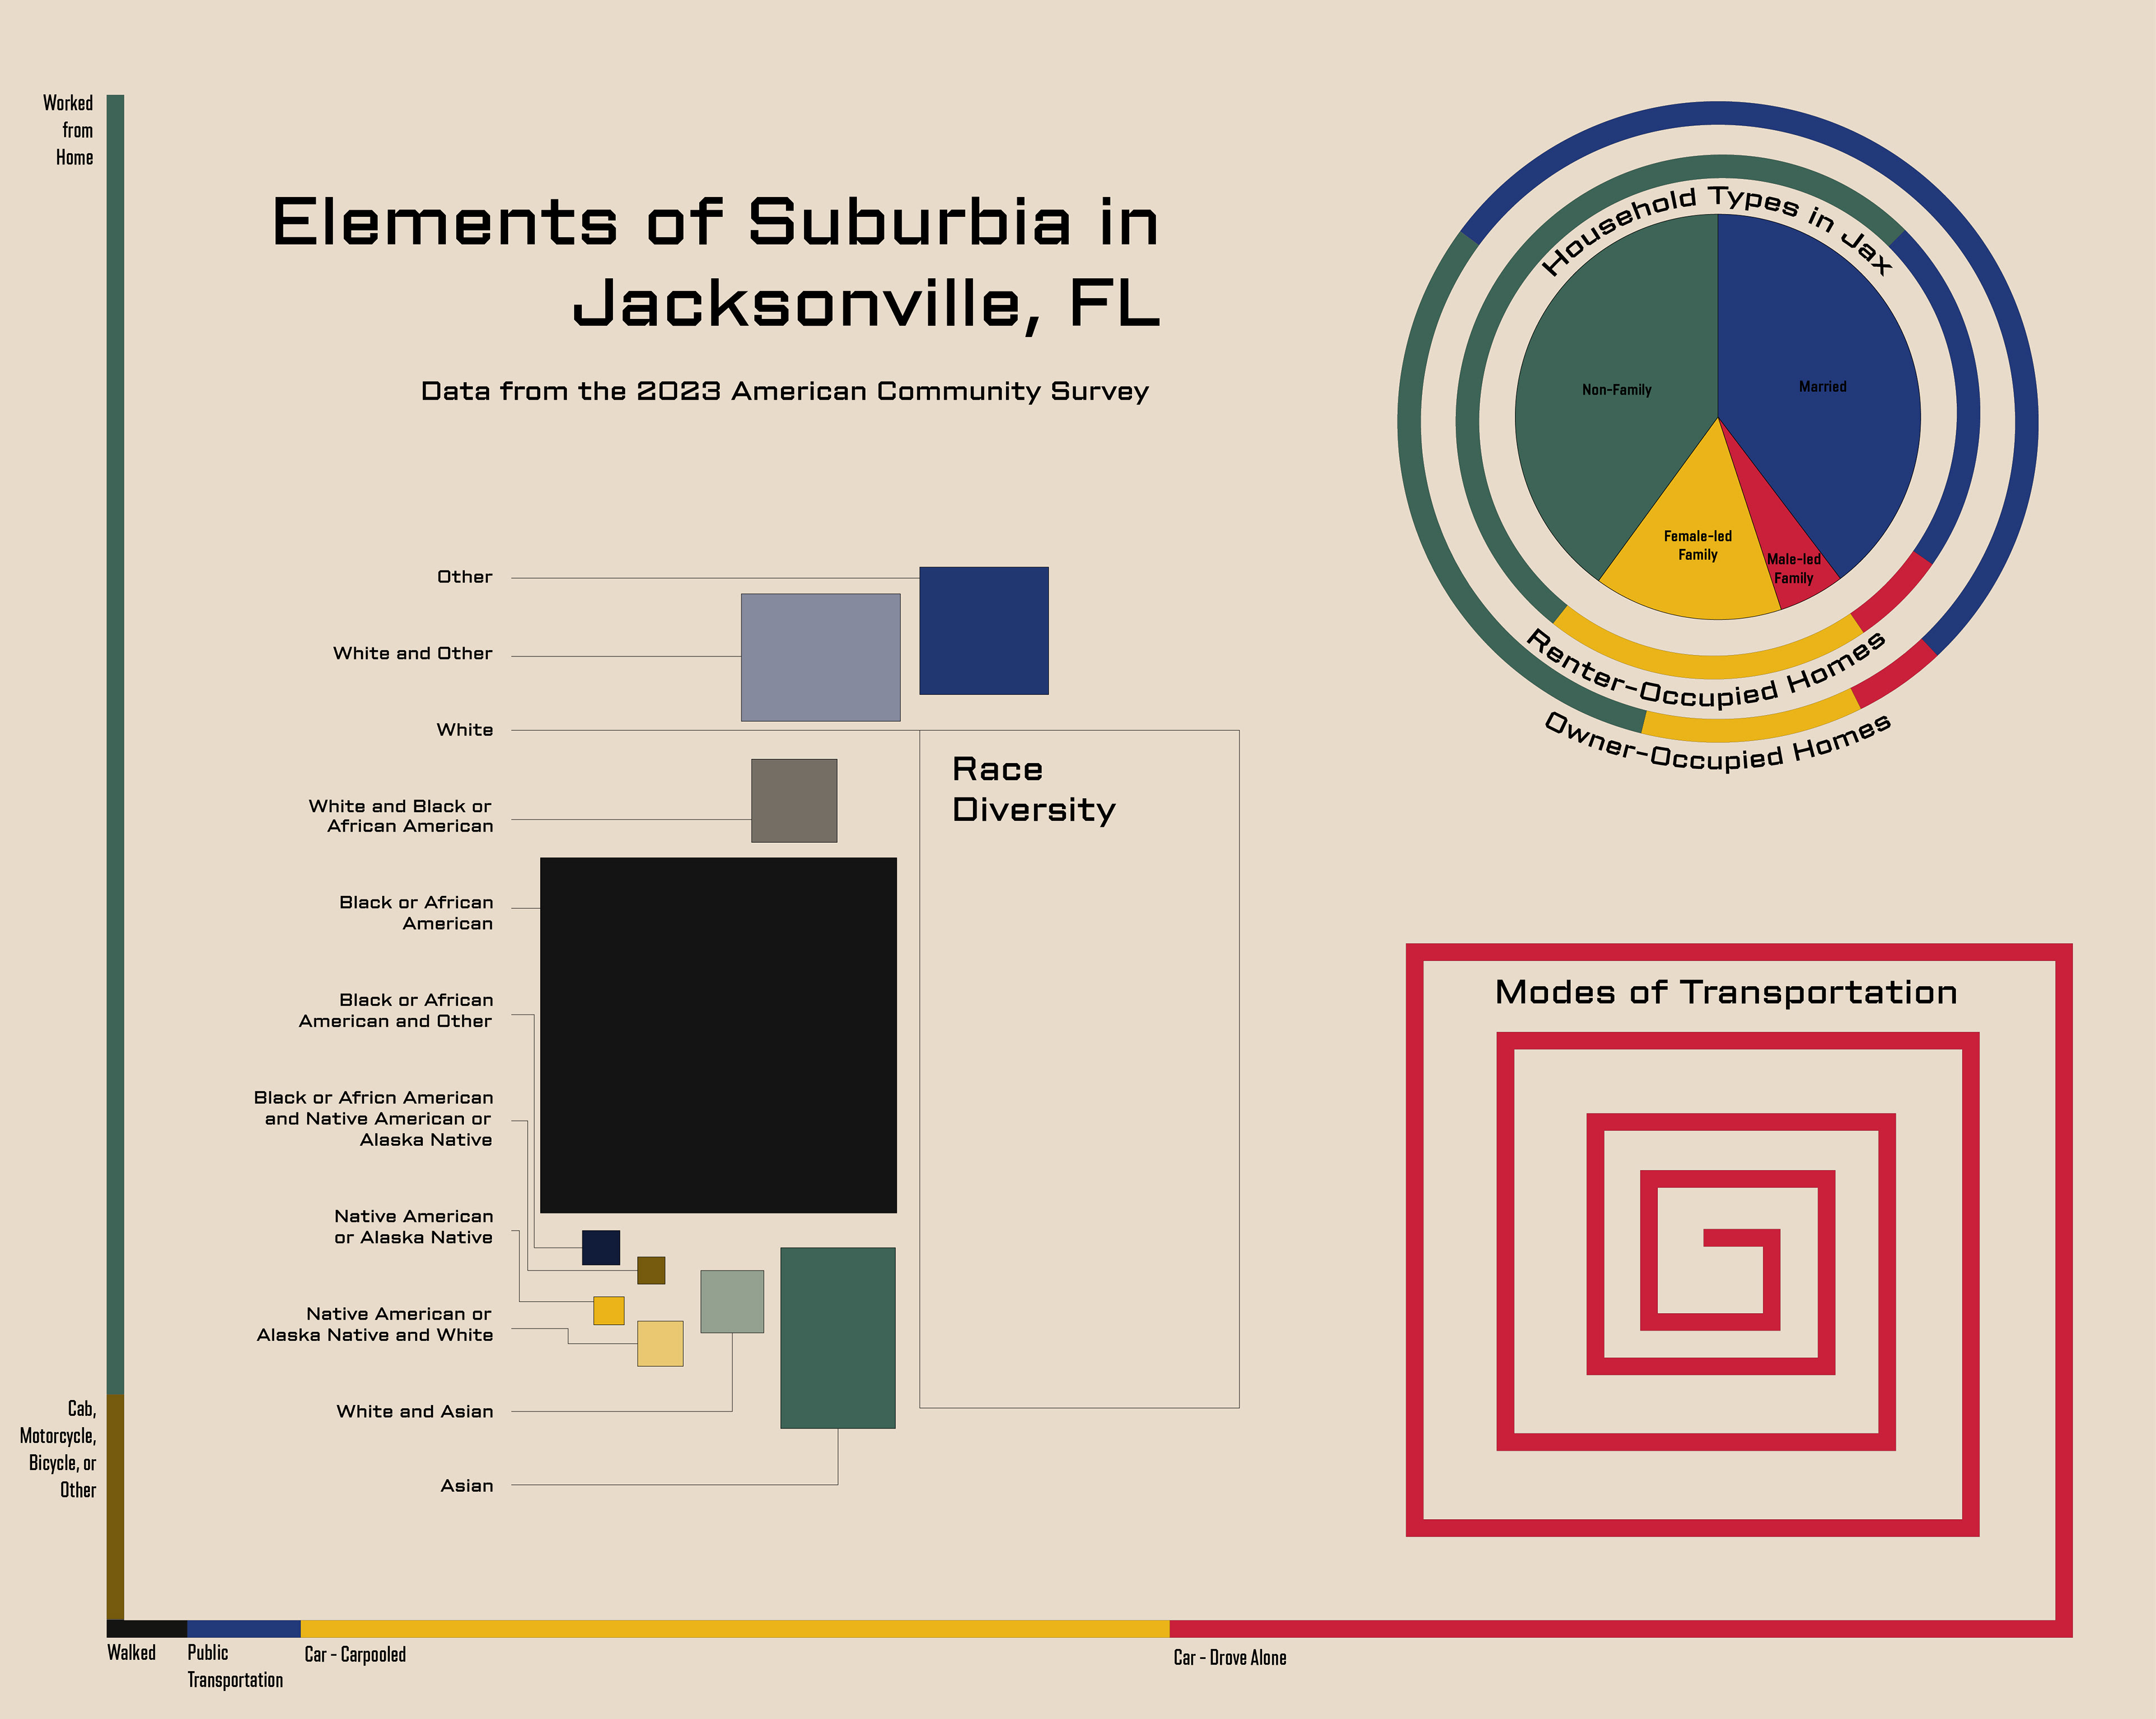
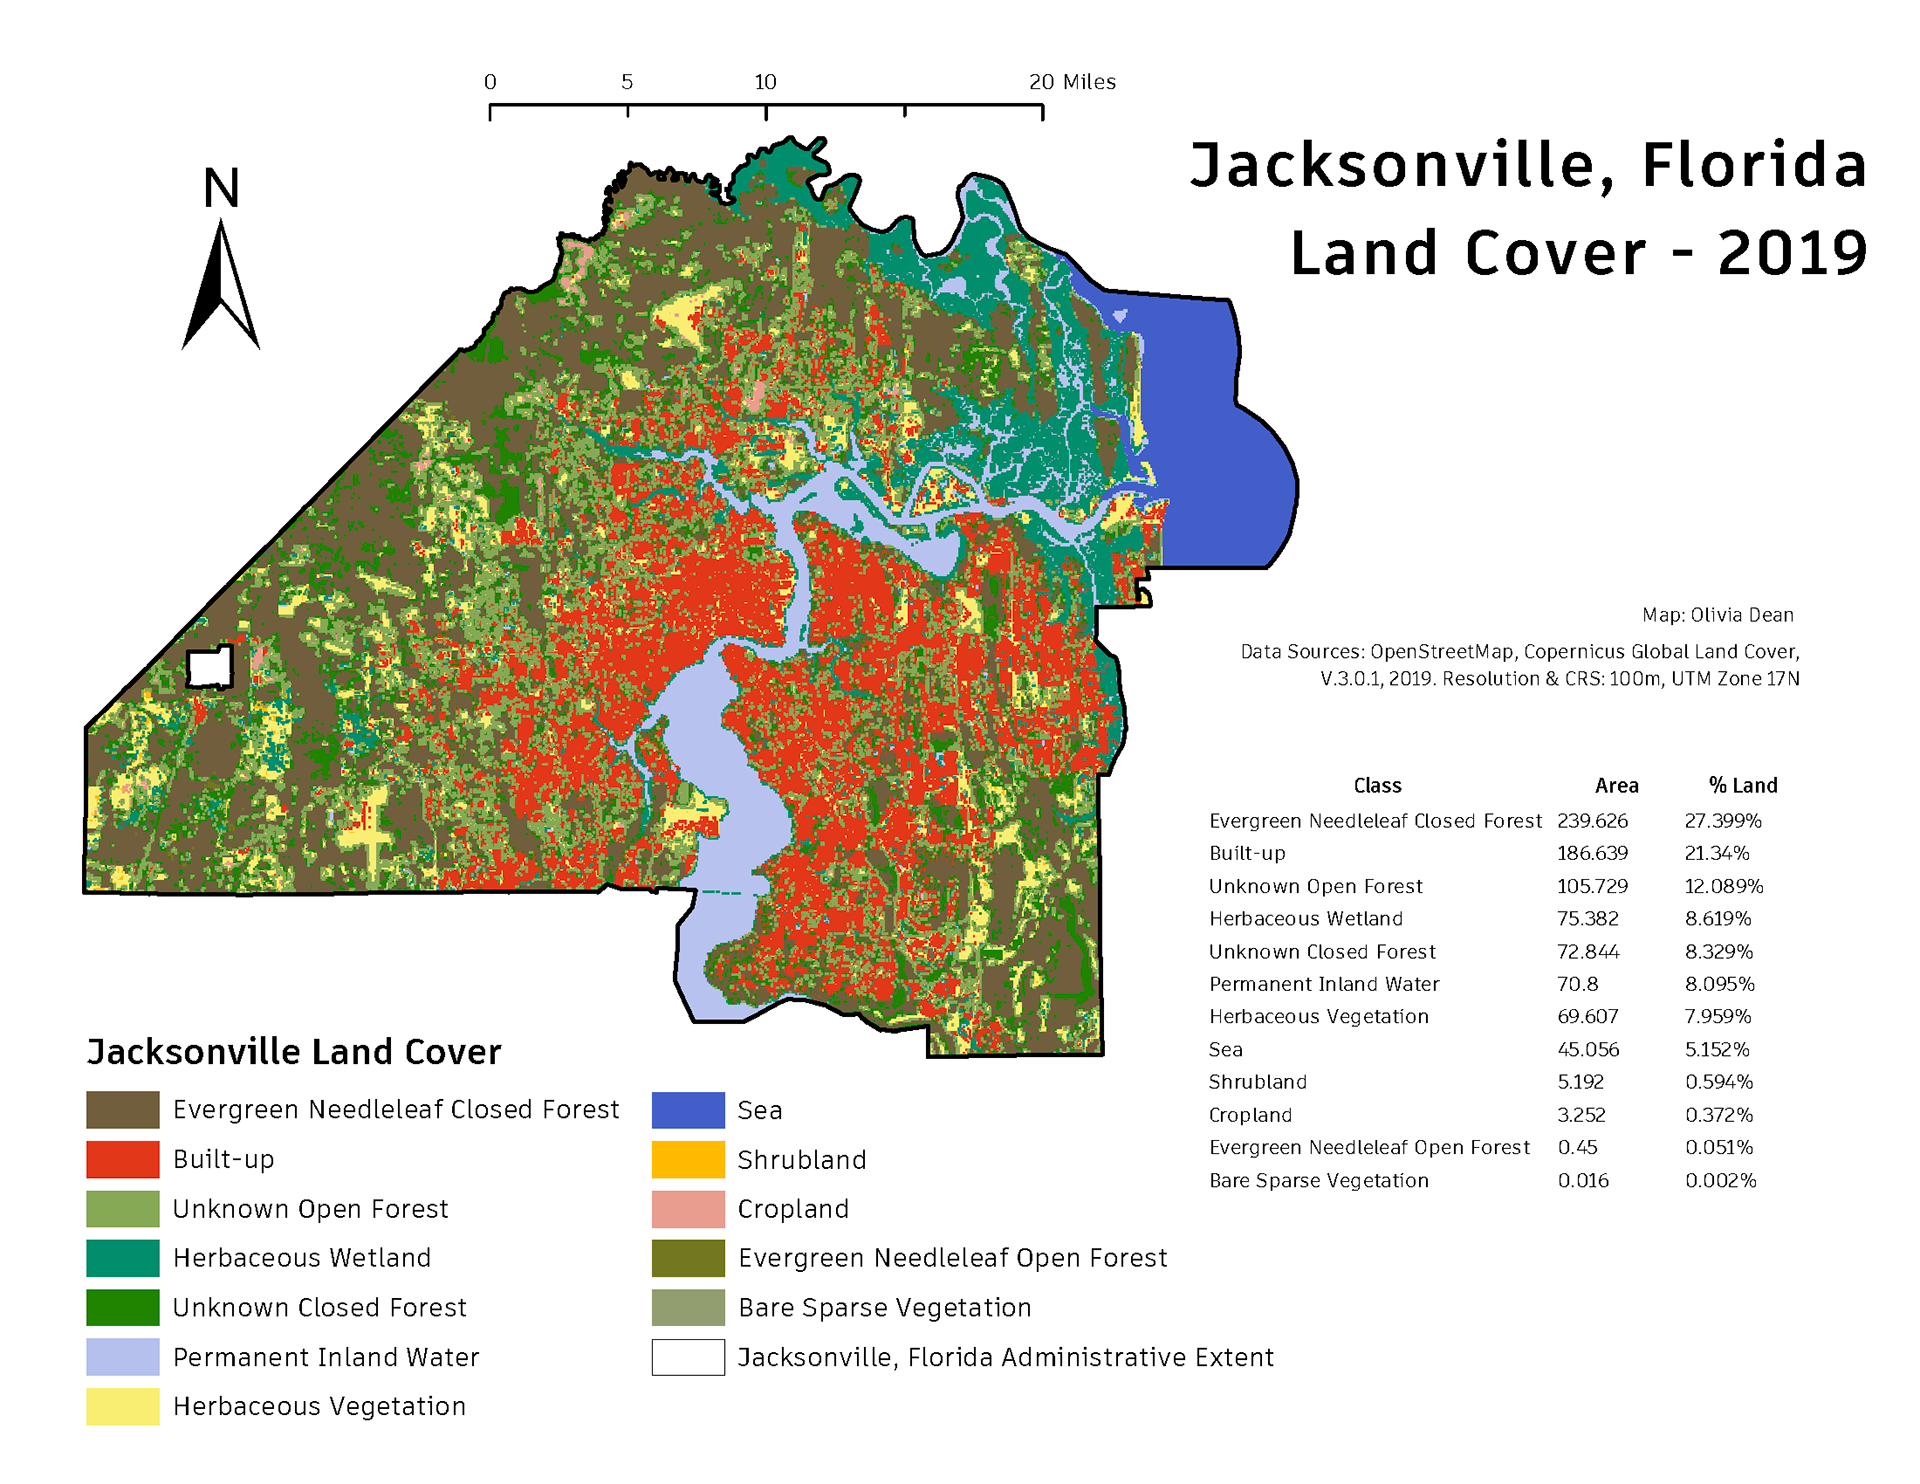
Suburbia in My Hometown
Studying Race, Modes of Transportation, and Household Types in Jacksonville, Florida
For the 1900 Paris Exposition W.E.B. Du Bois created two data visualization series that illustrated the lives and wealth of The Georgia Negro and The condition of the descendants of former African slaves now in residence in the US. Since learning about this work, Du Bois’ work has largely influenced the way I approach data visualization. So when I wanted to visualize data about elements of suburbia in my hometown of Jacksonville, Florida, I felt compelled to use his work as stylistic inspiration. Not only because of my love for his work, but because of how connected Suburbia is to the post-emancipation politics and society that Du Bois was studying in 1900.
Overall, studying the distribution of race, transportation, and household types in my hometown was very informative to how I view the different areas of my city. I grew up in a very white, wealthy, car dependent zipcode of Jacksonville and the experience of going to New York for college made me especially aware of this. These visualizations are meant to illustrate the discriminative disparities that persist in suburban infrastructure.
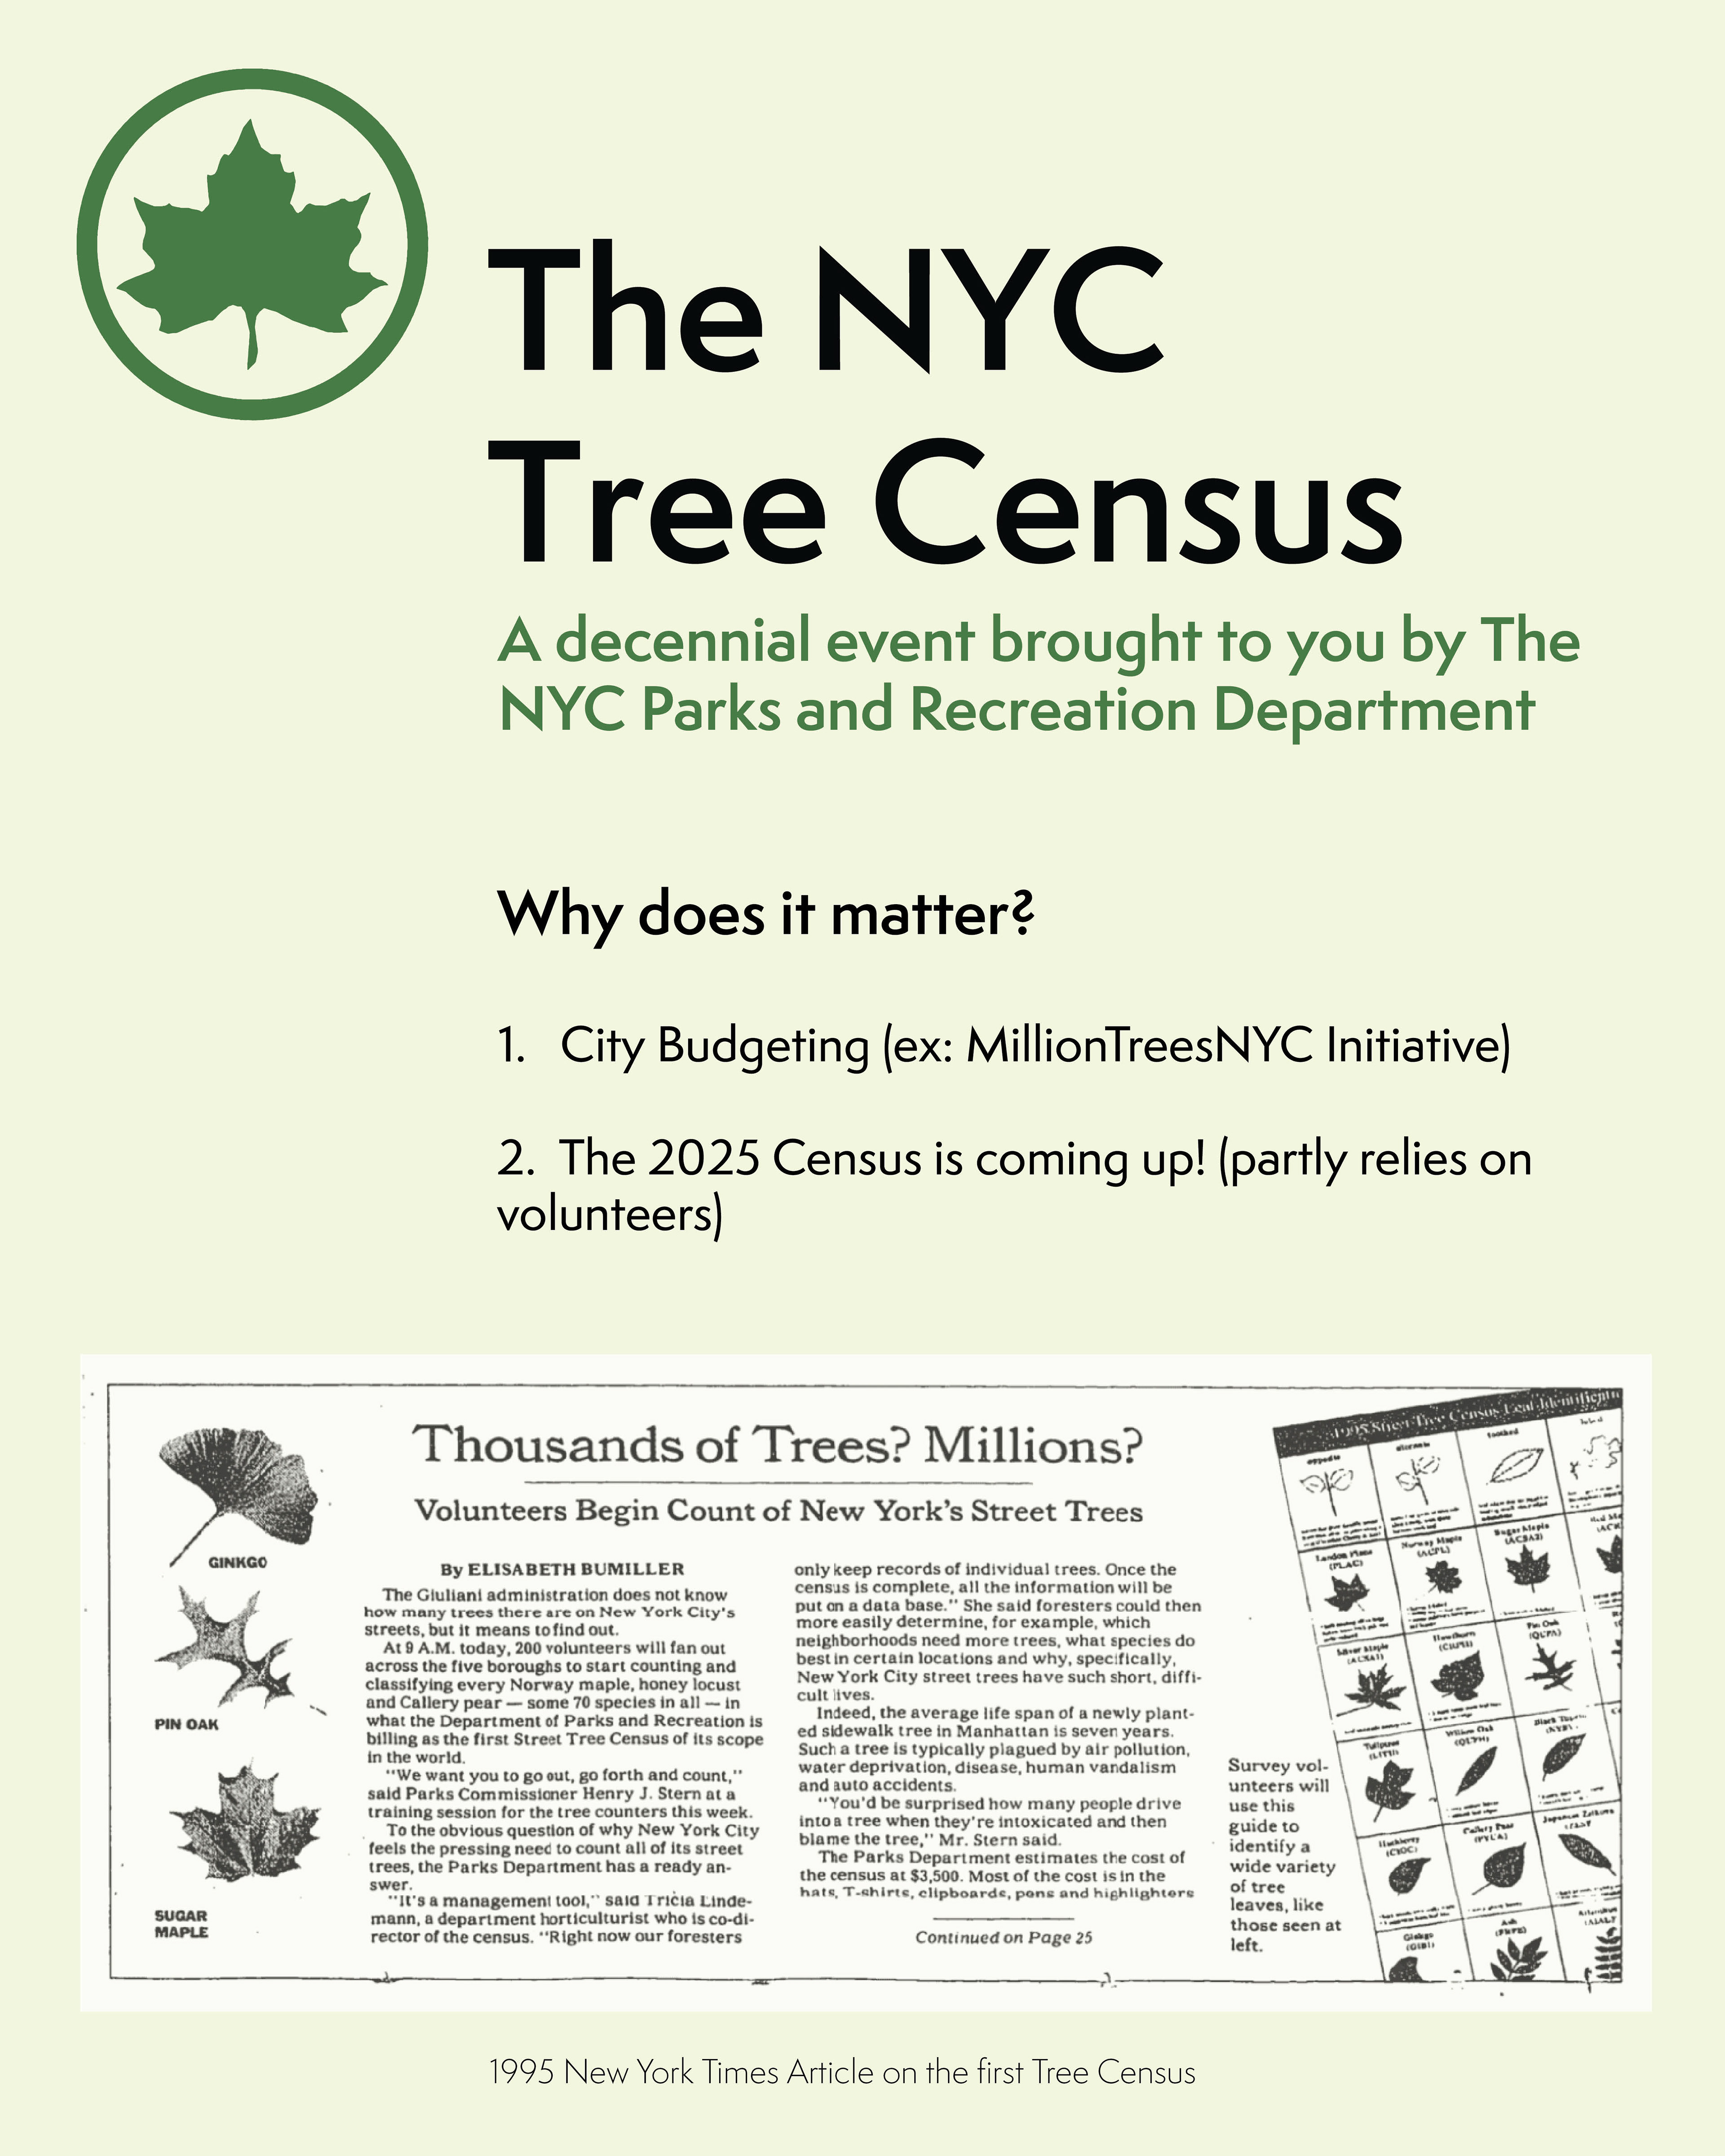
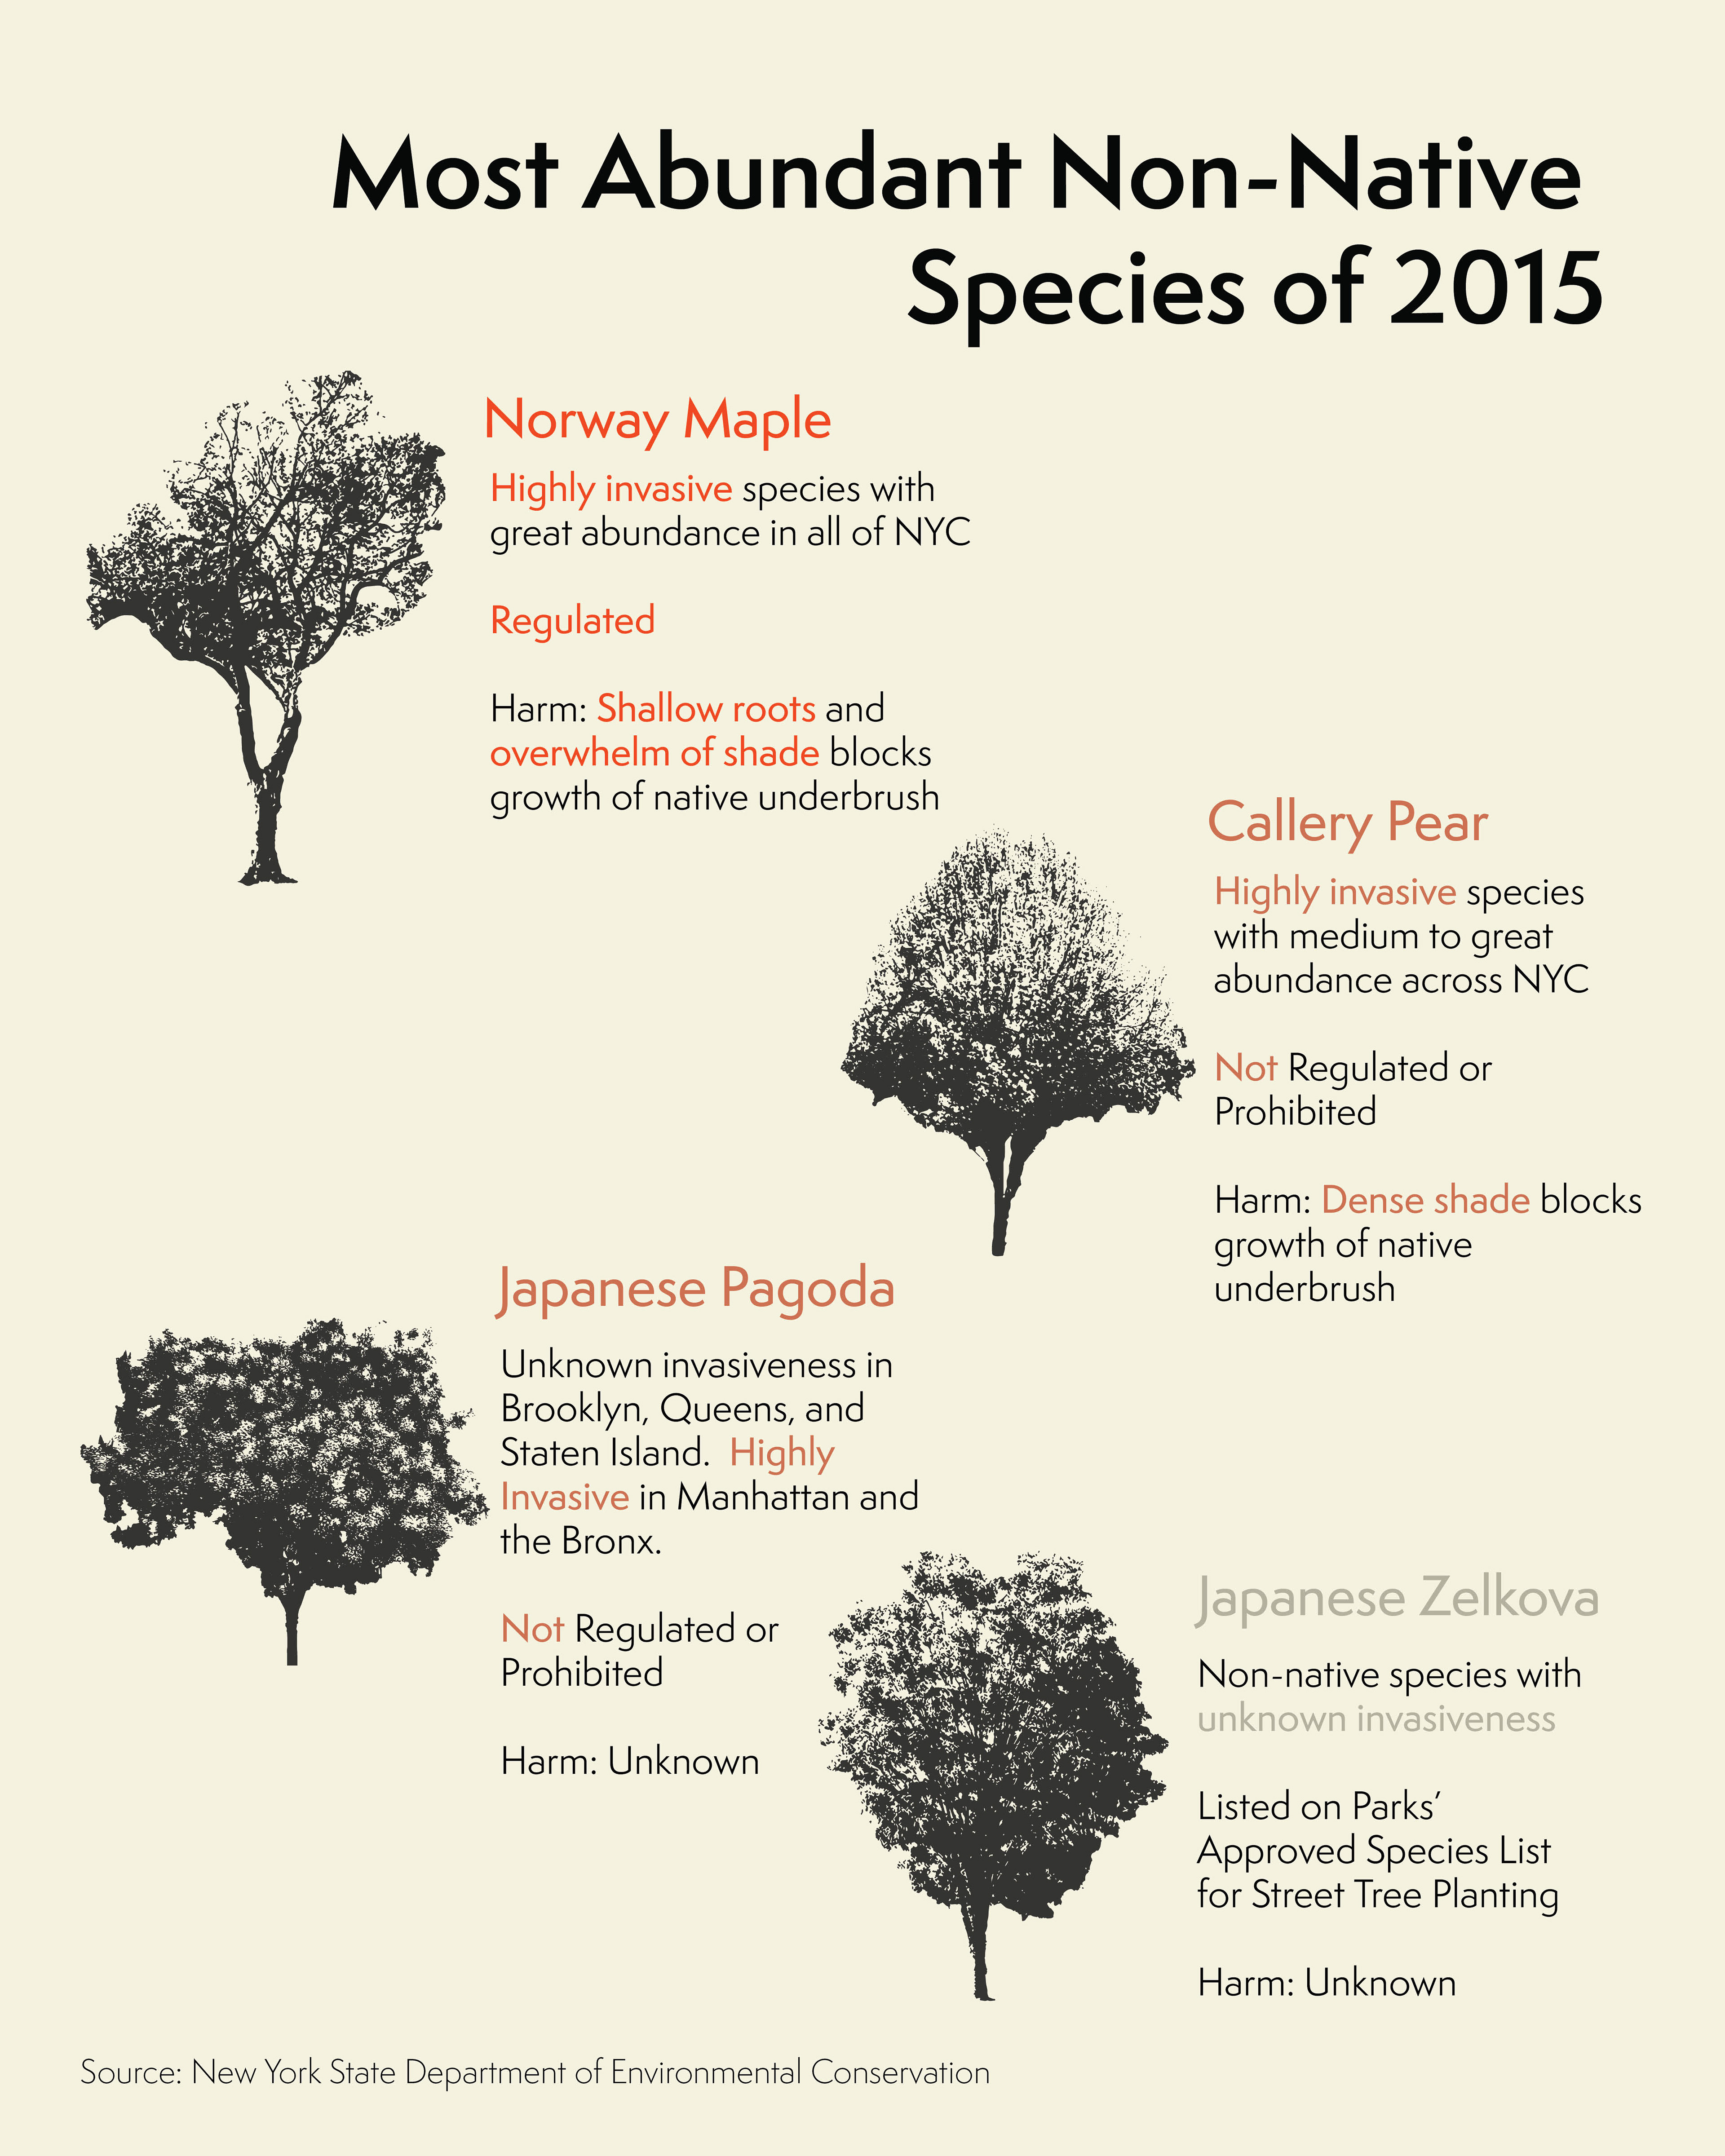
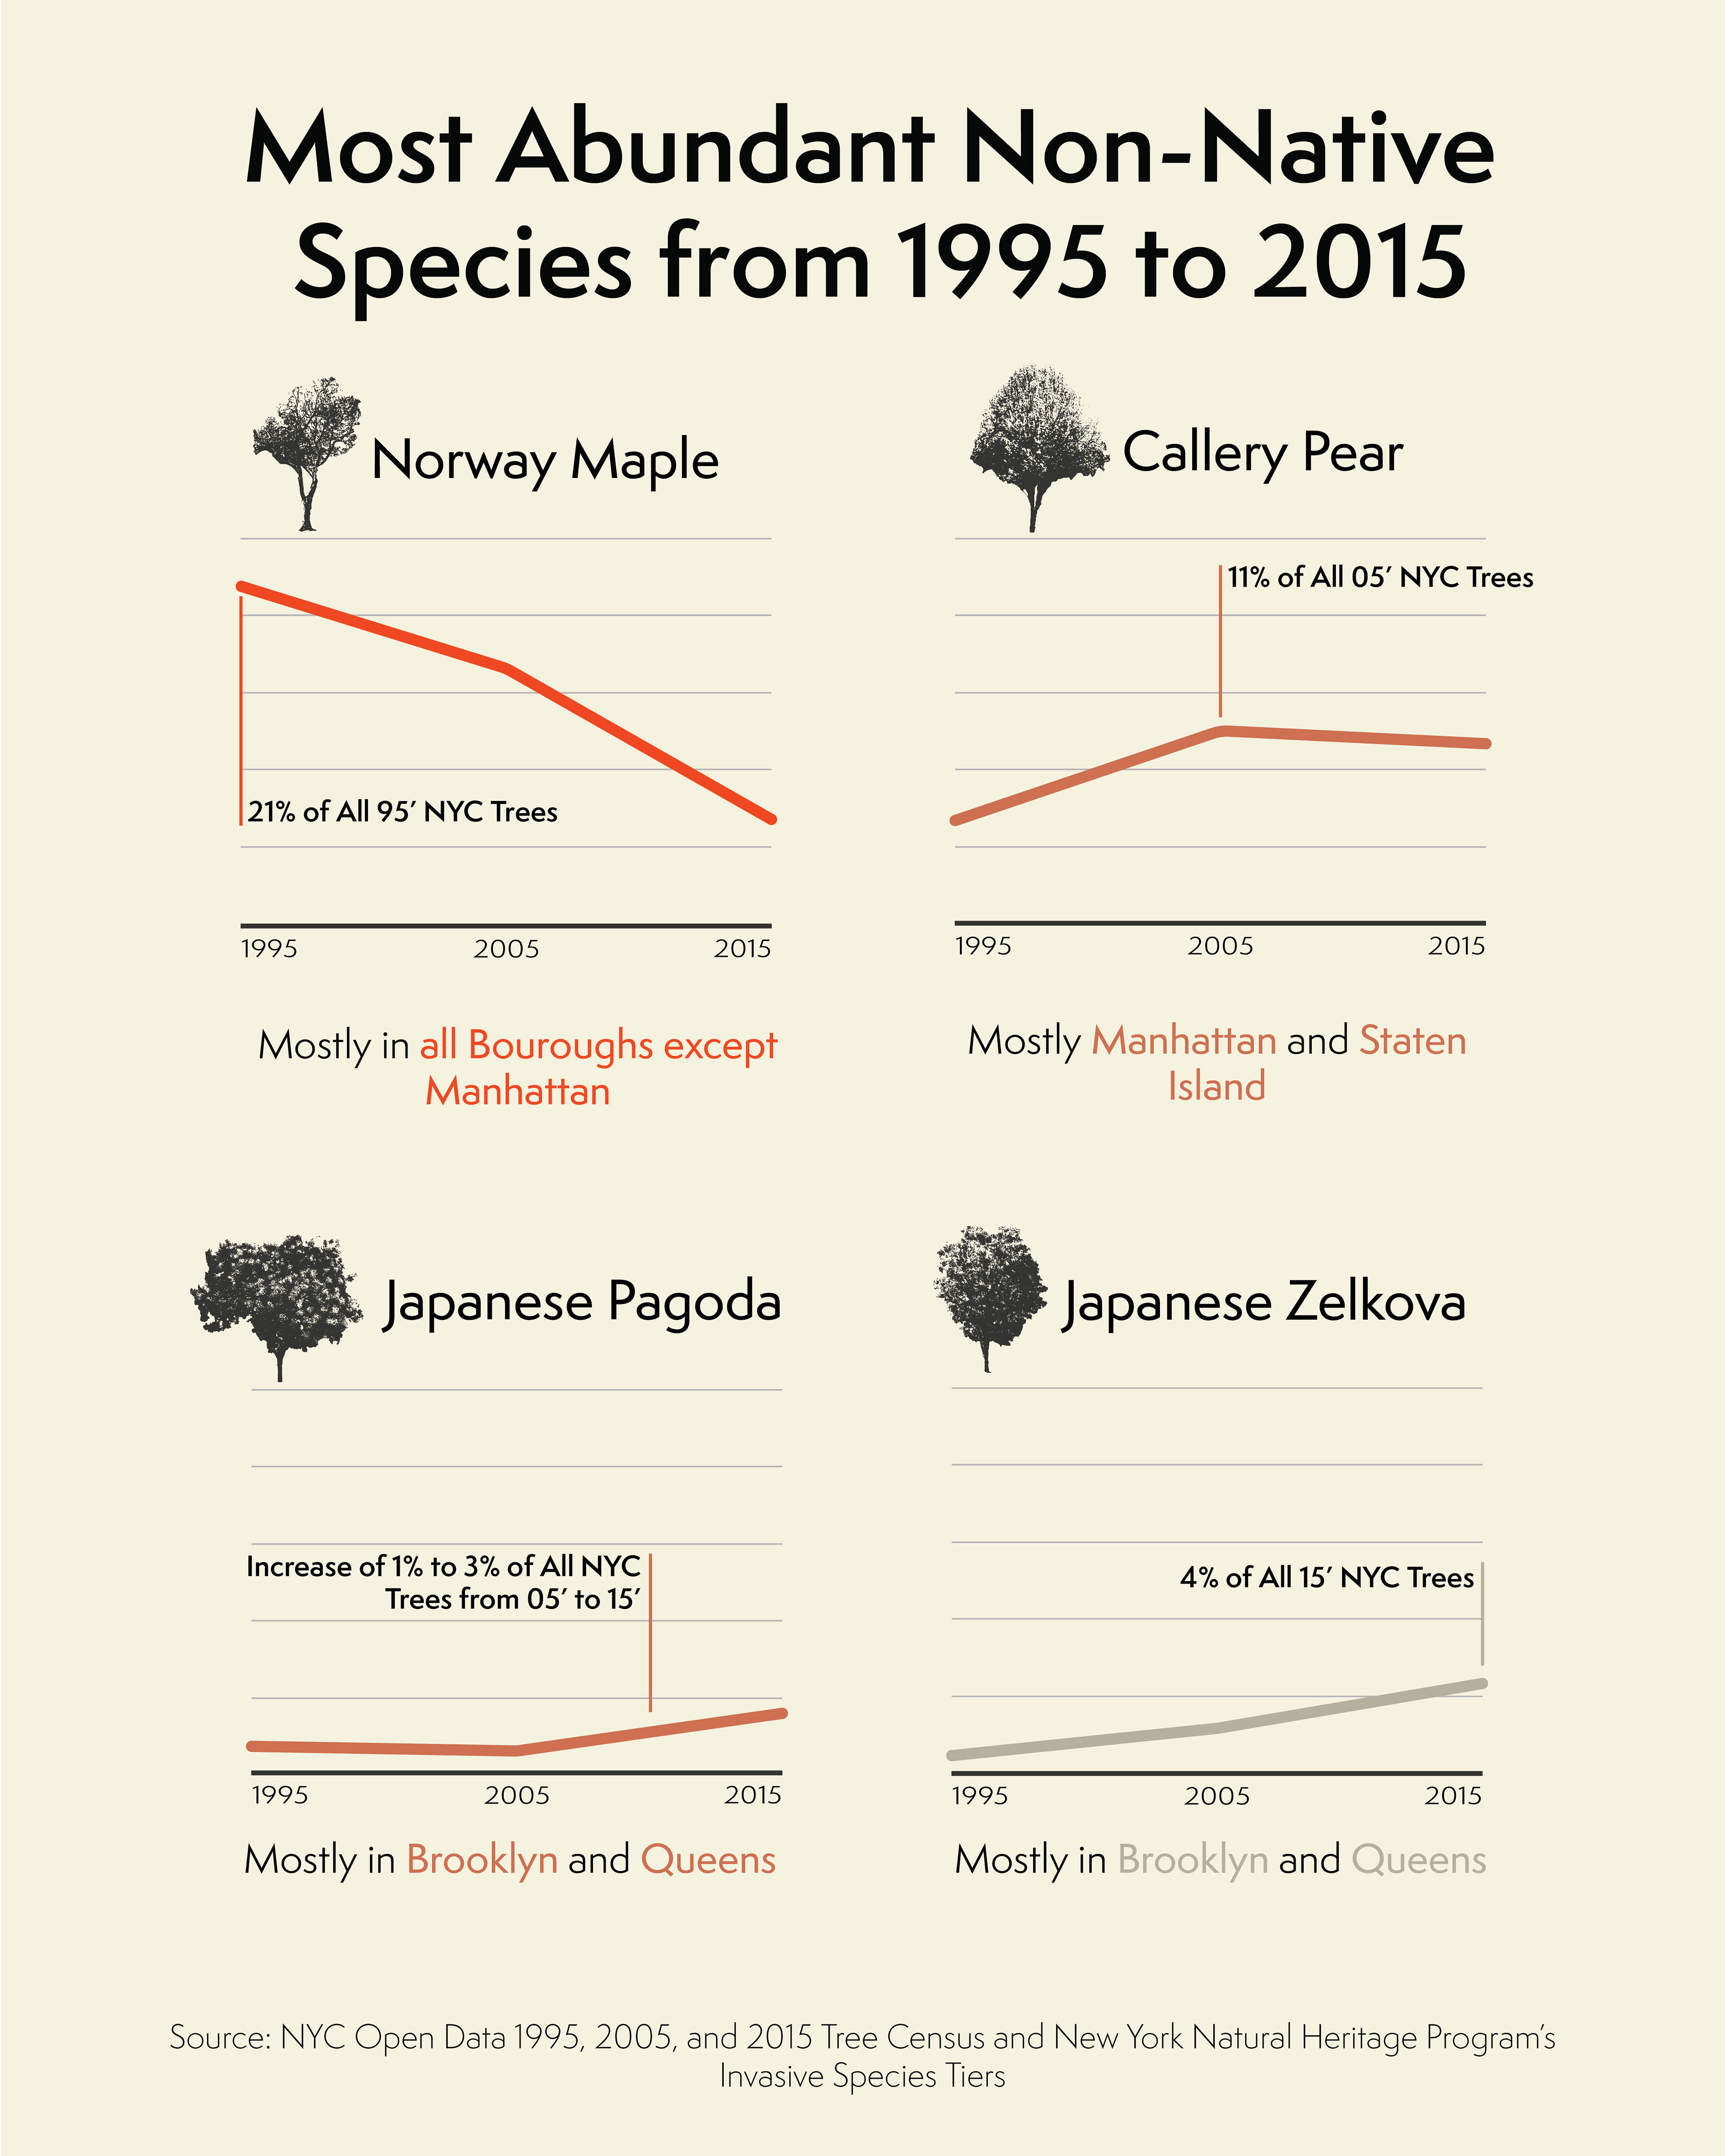
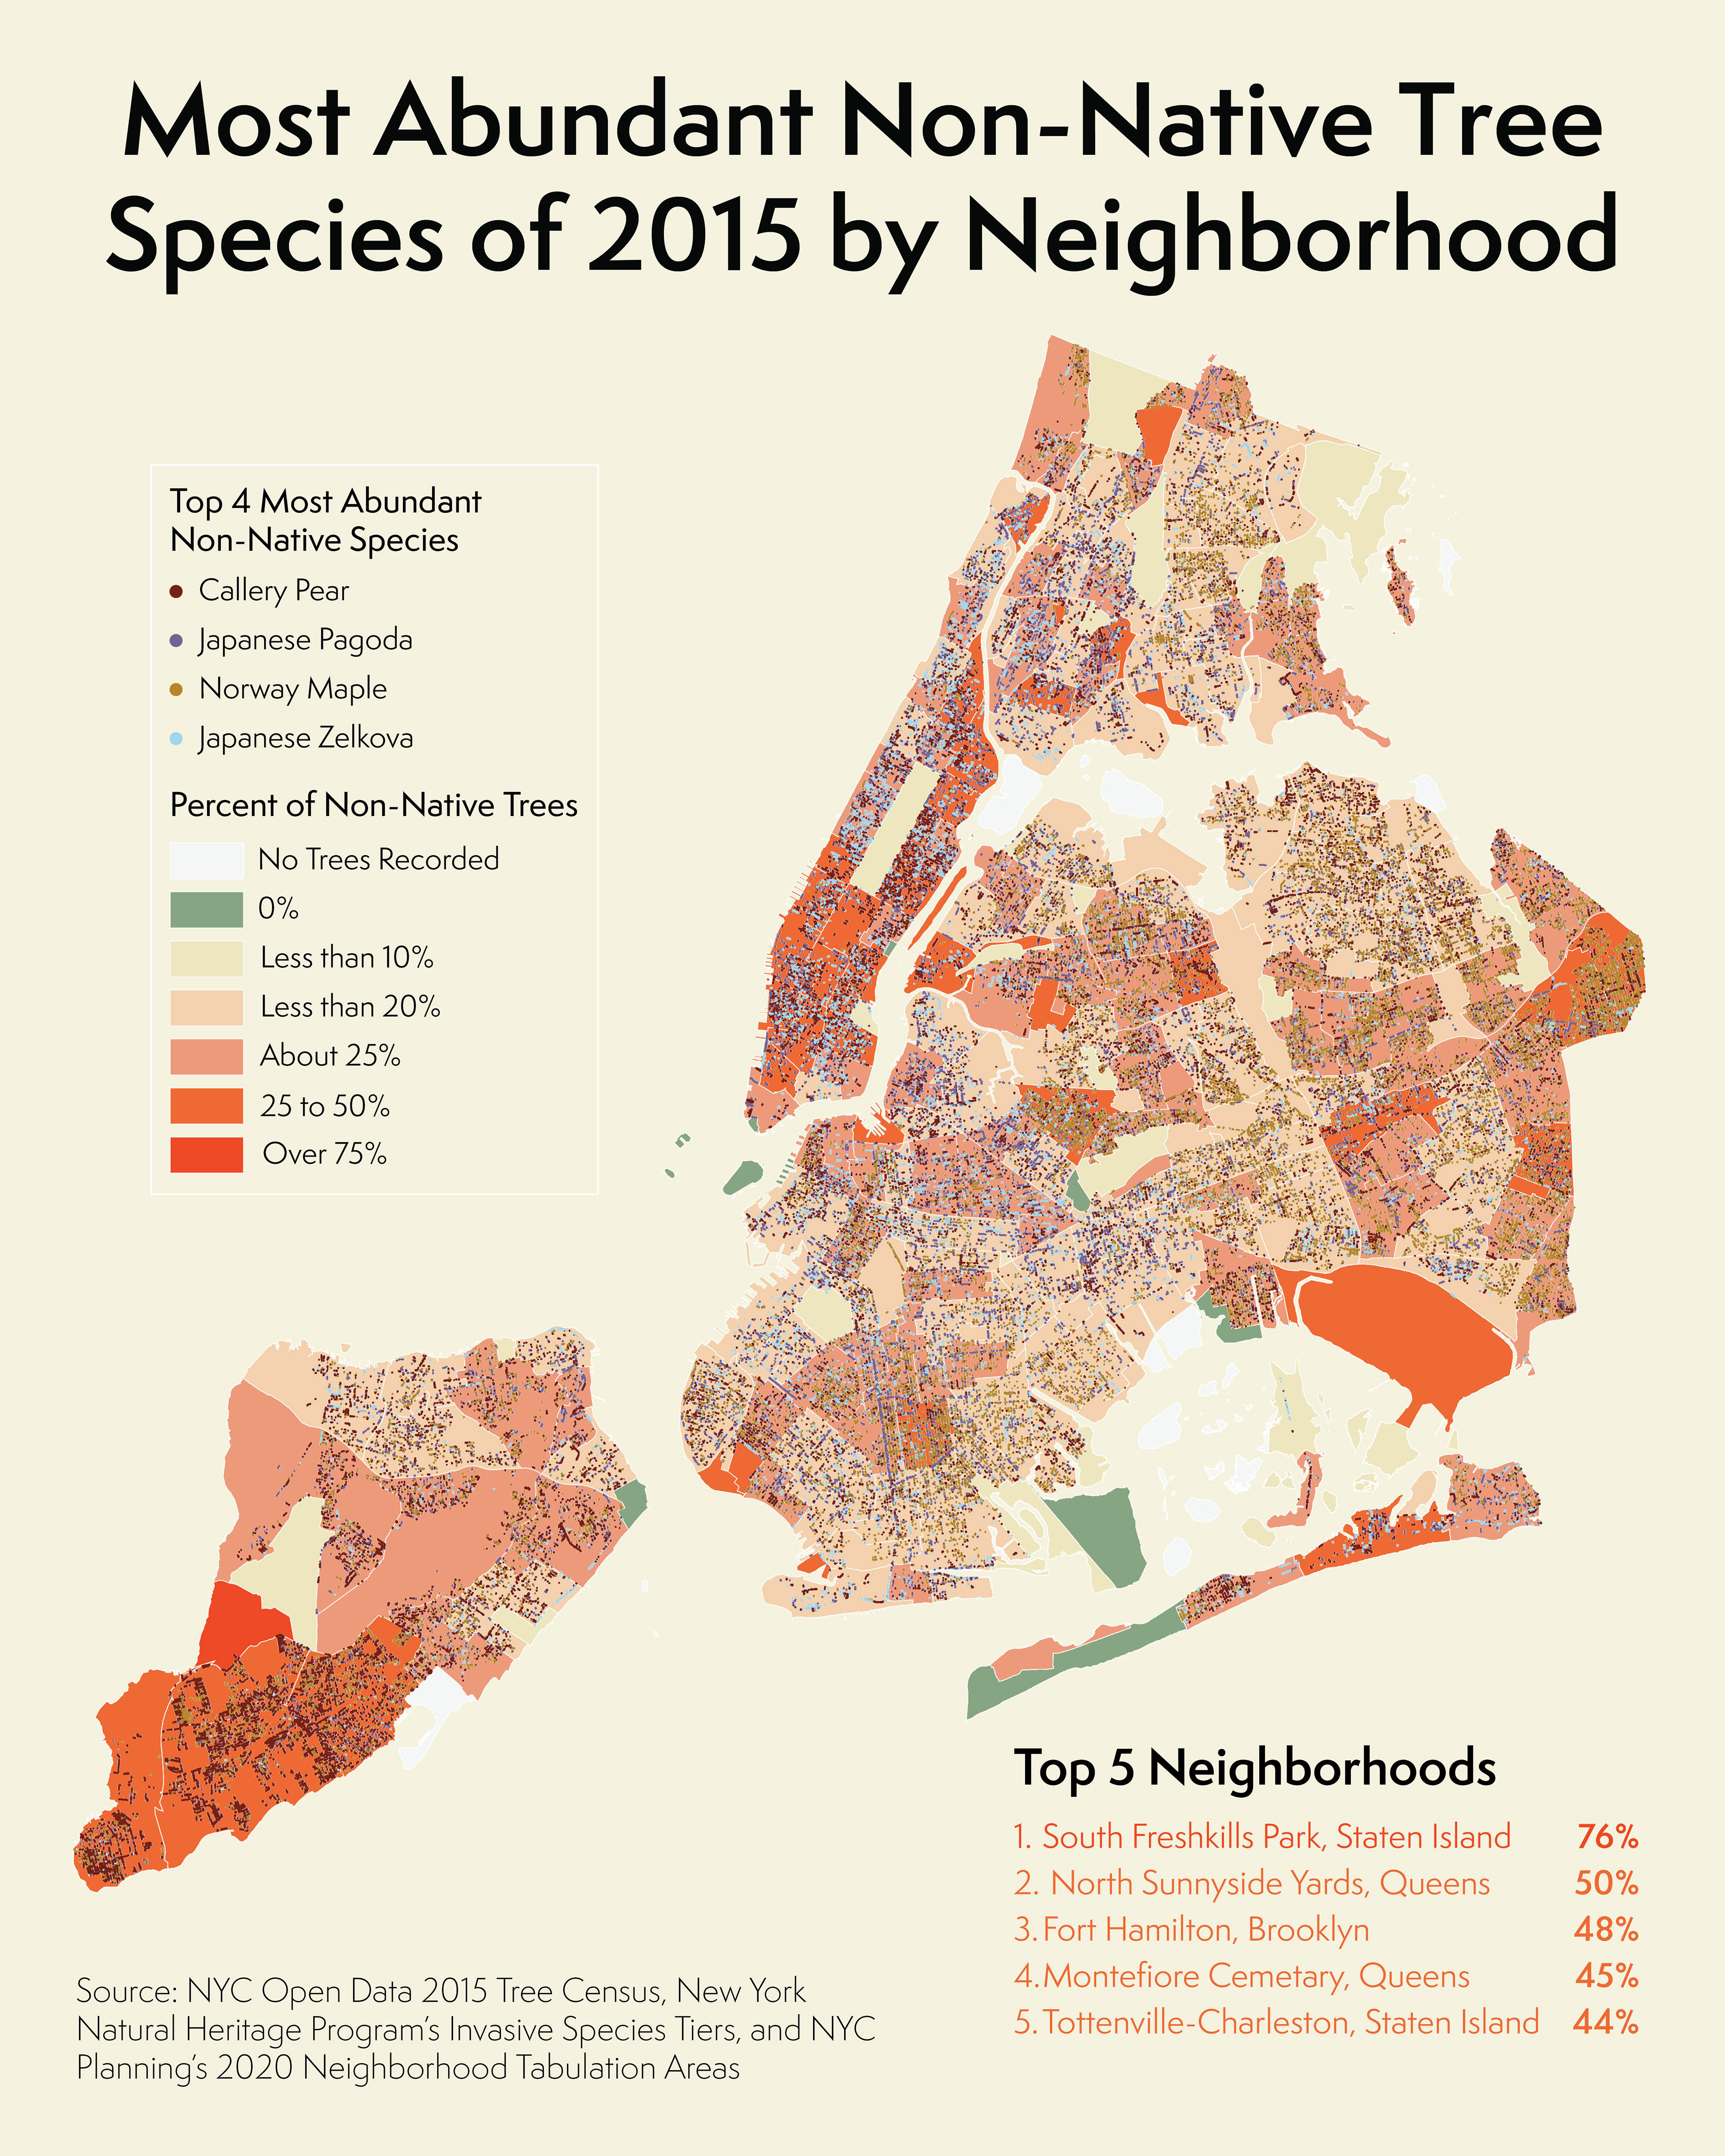
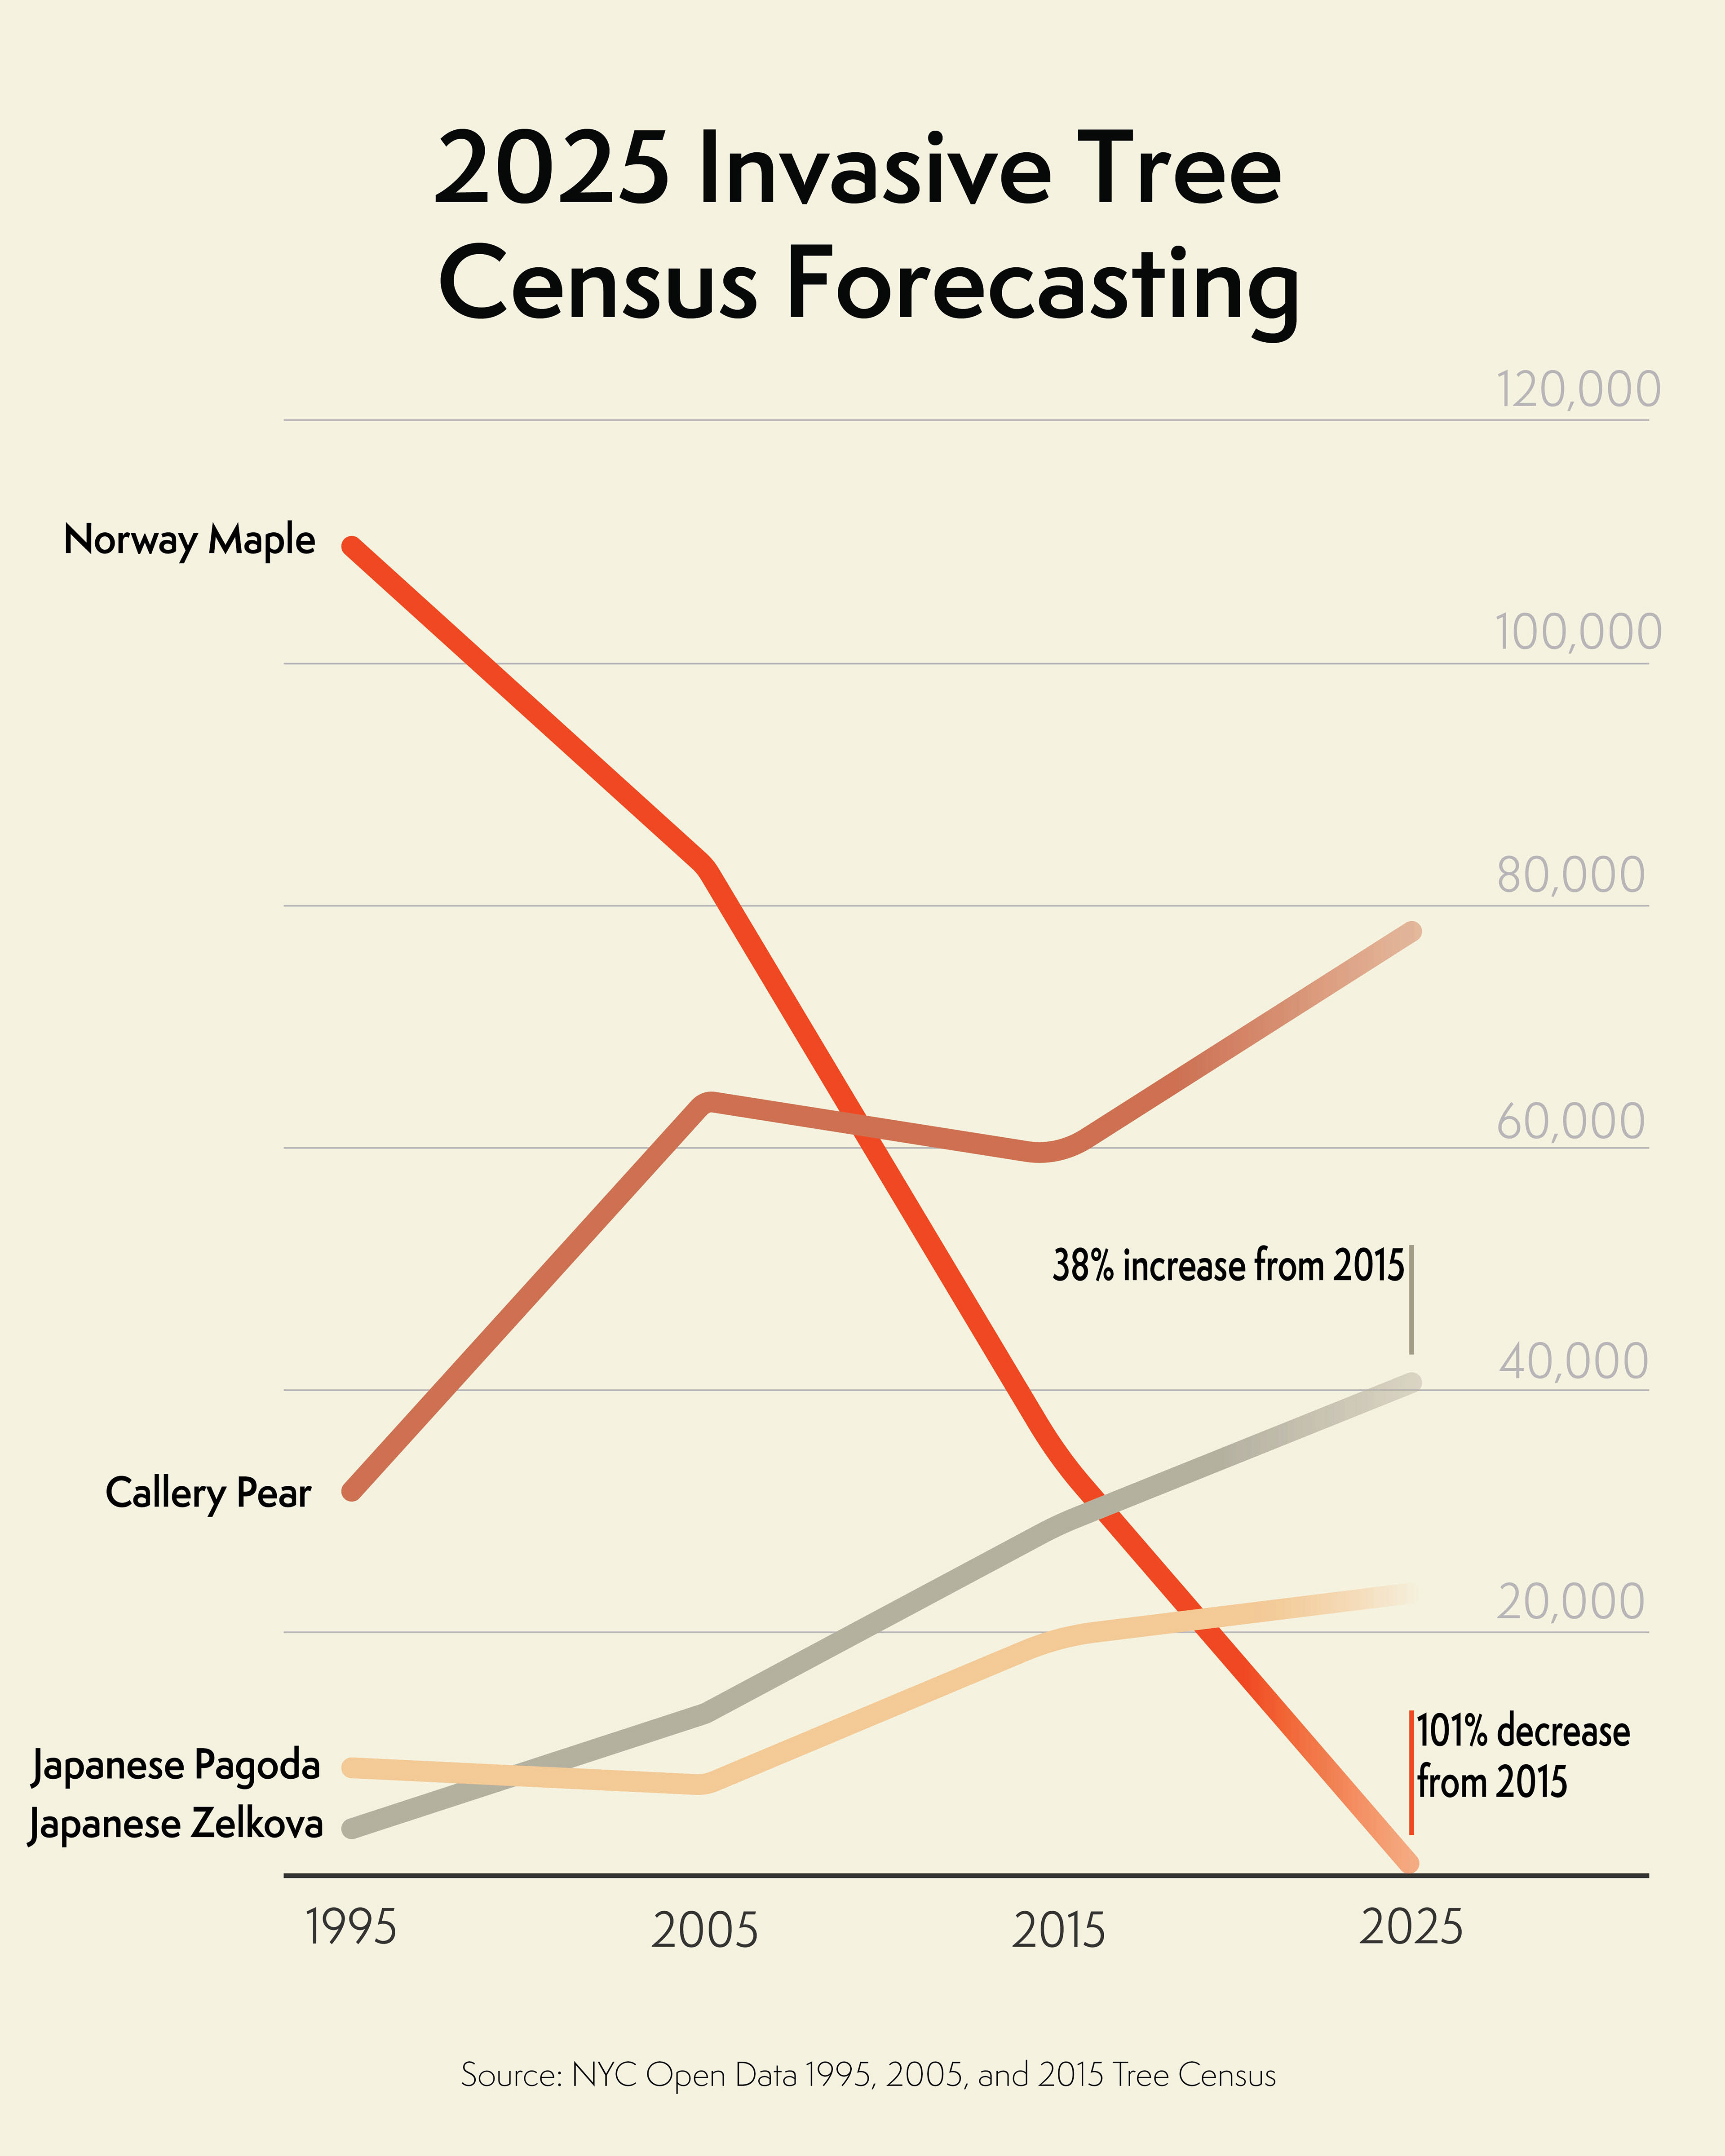
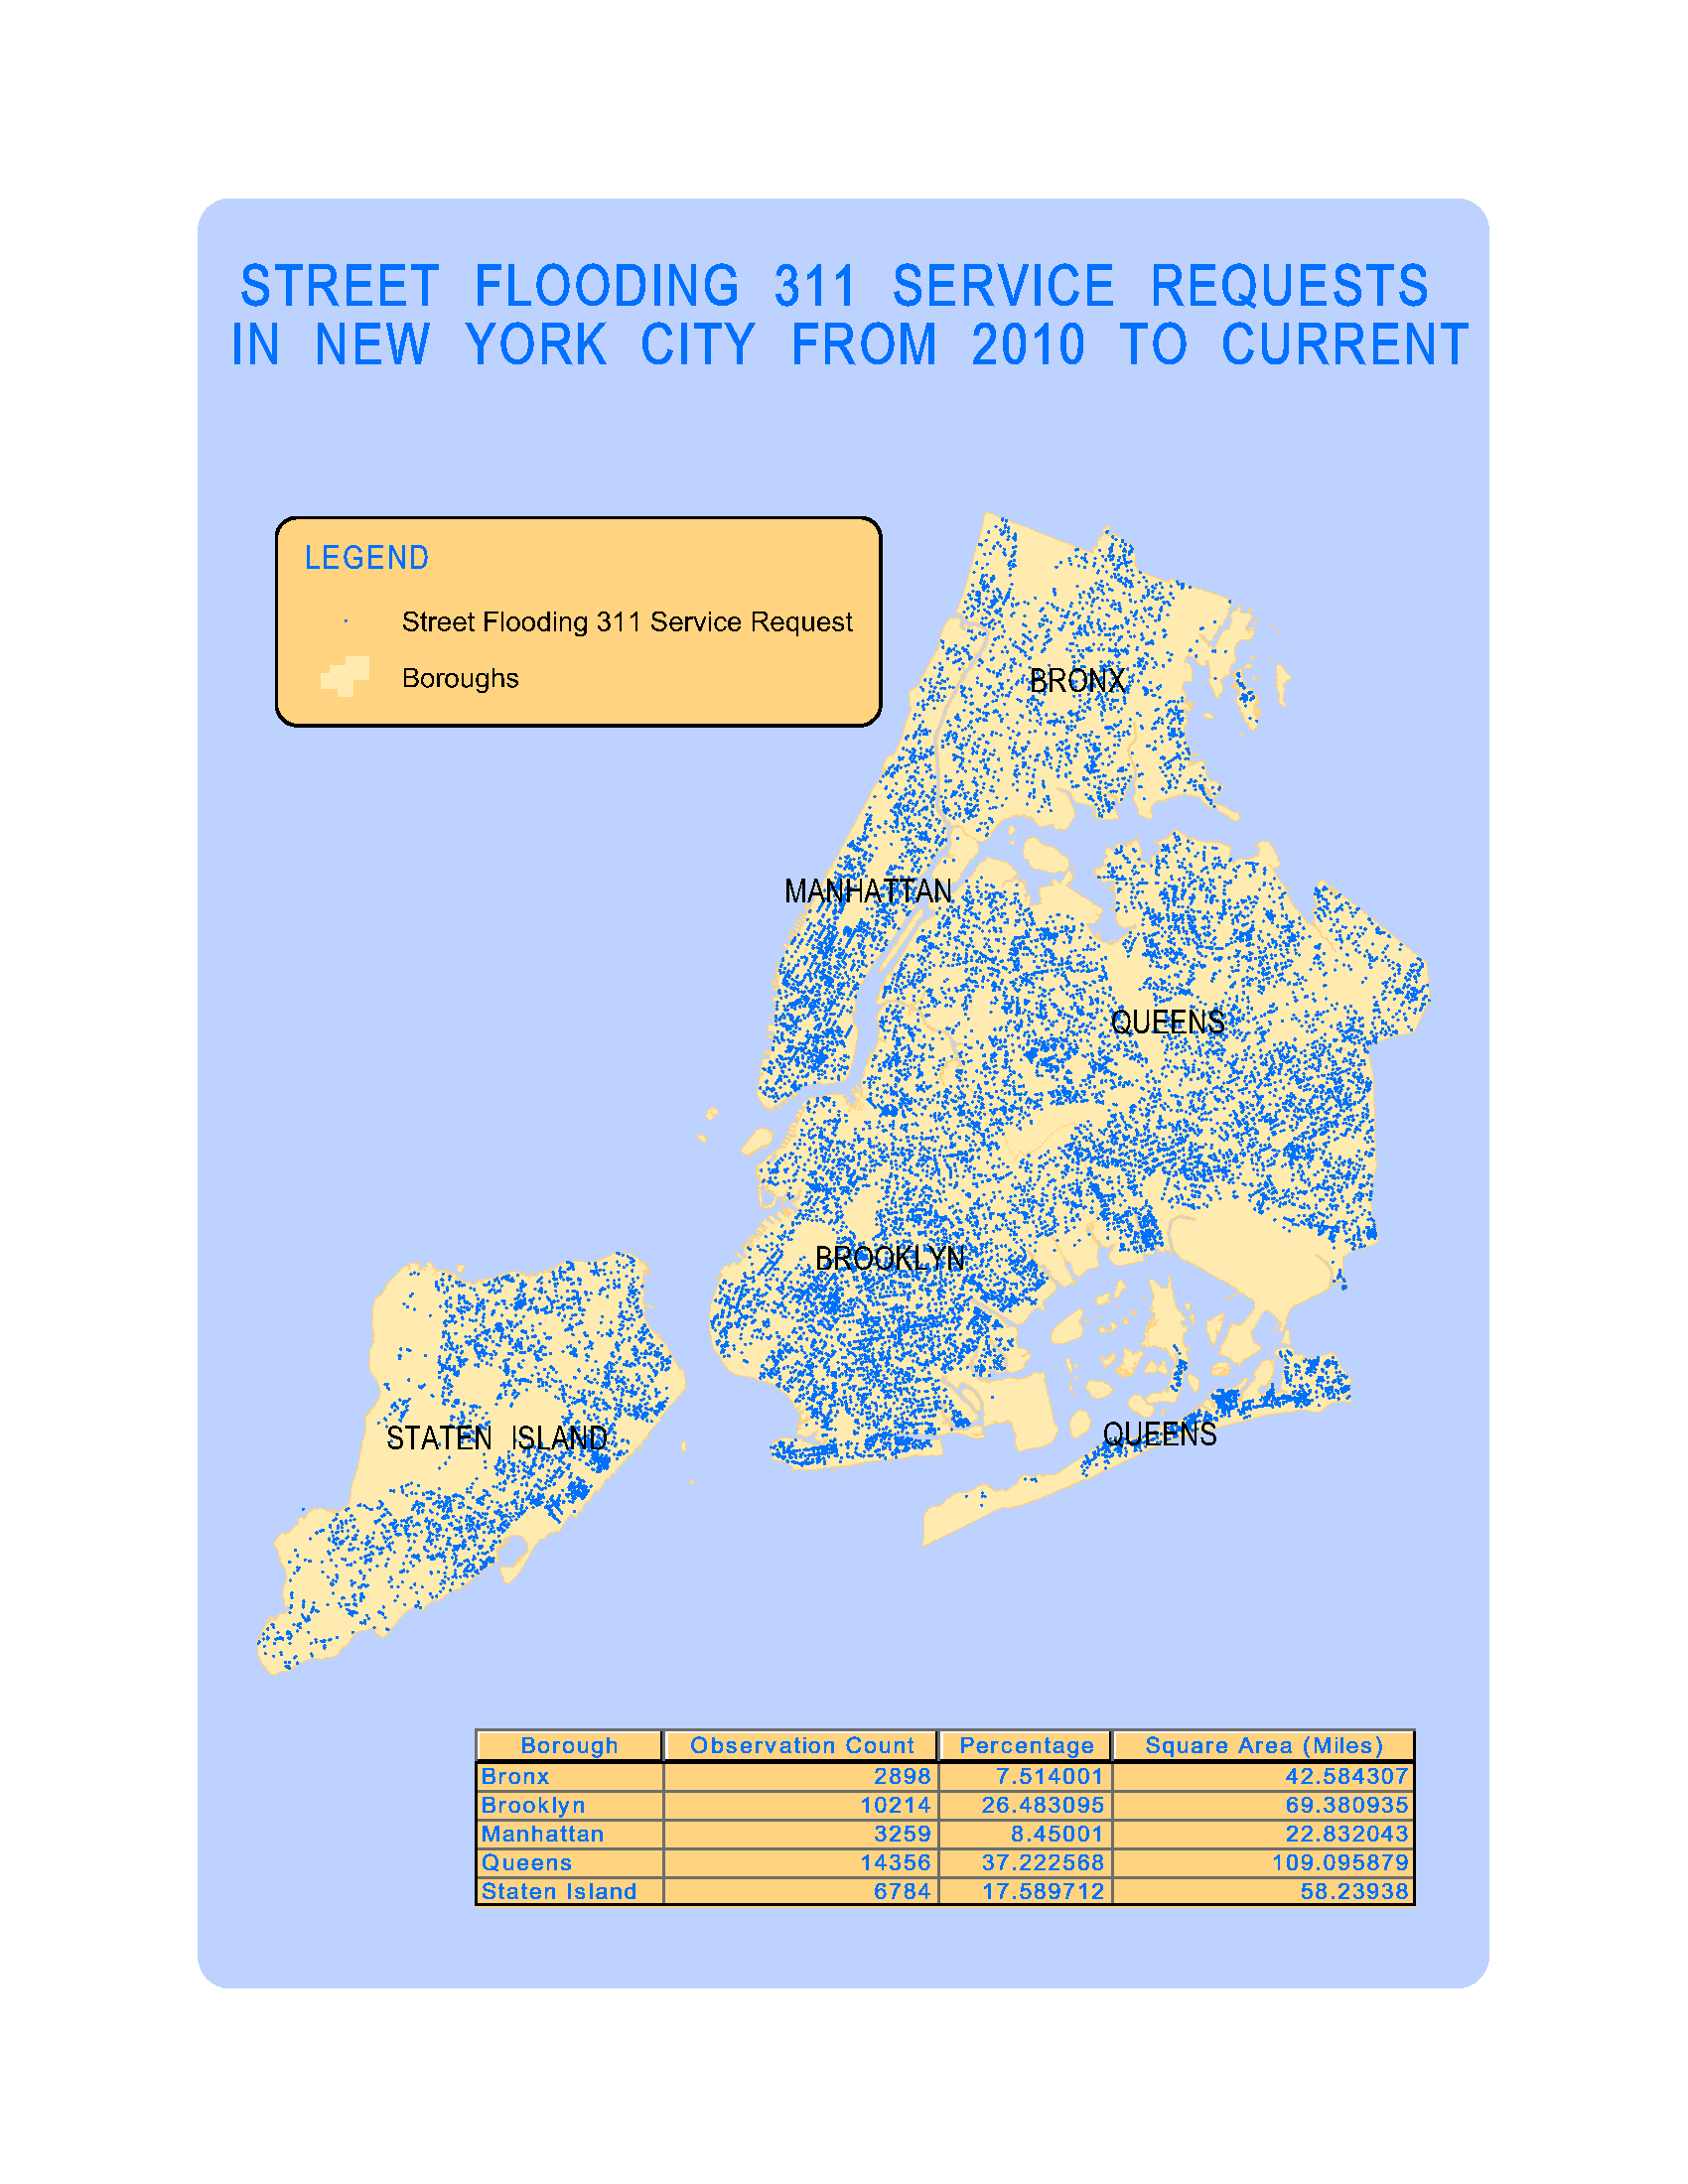
Invasiveness of NYC Street Trees
Based on the NYC Parks and Recreation Street Tree Census
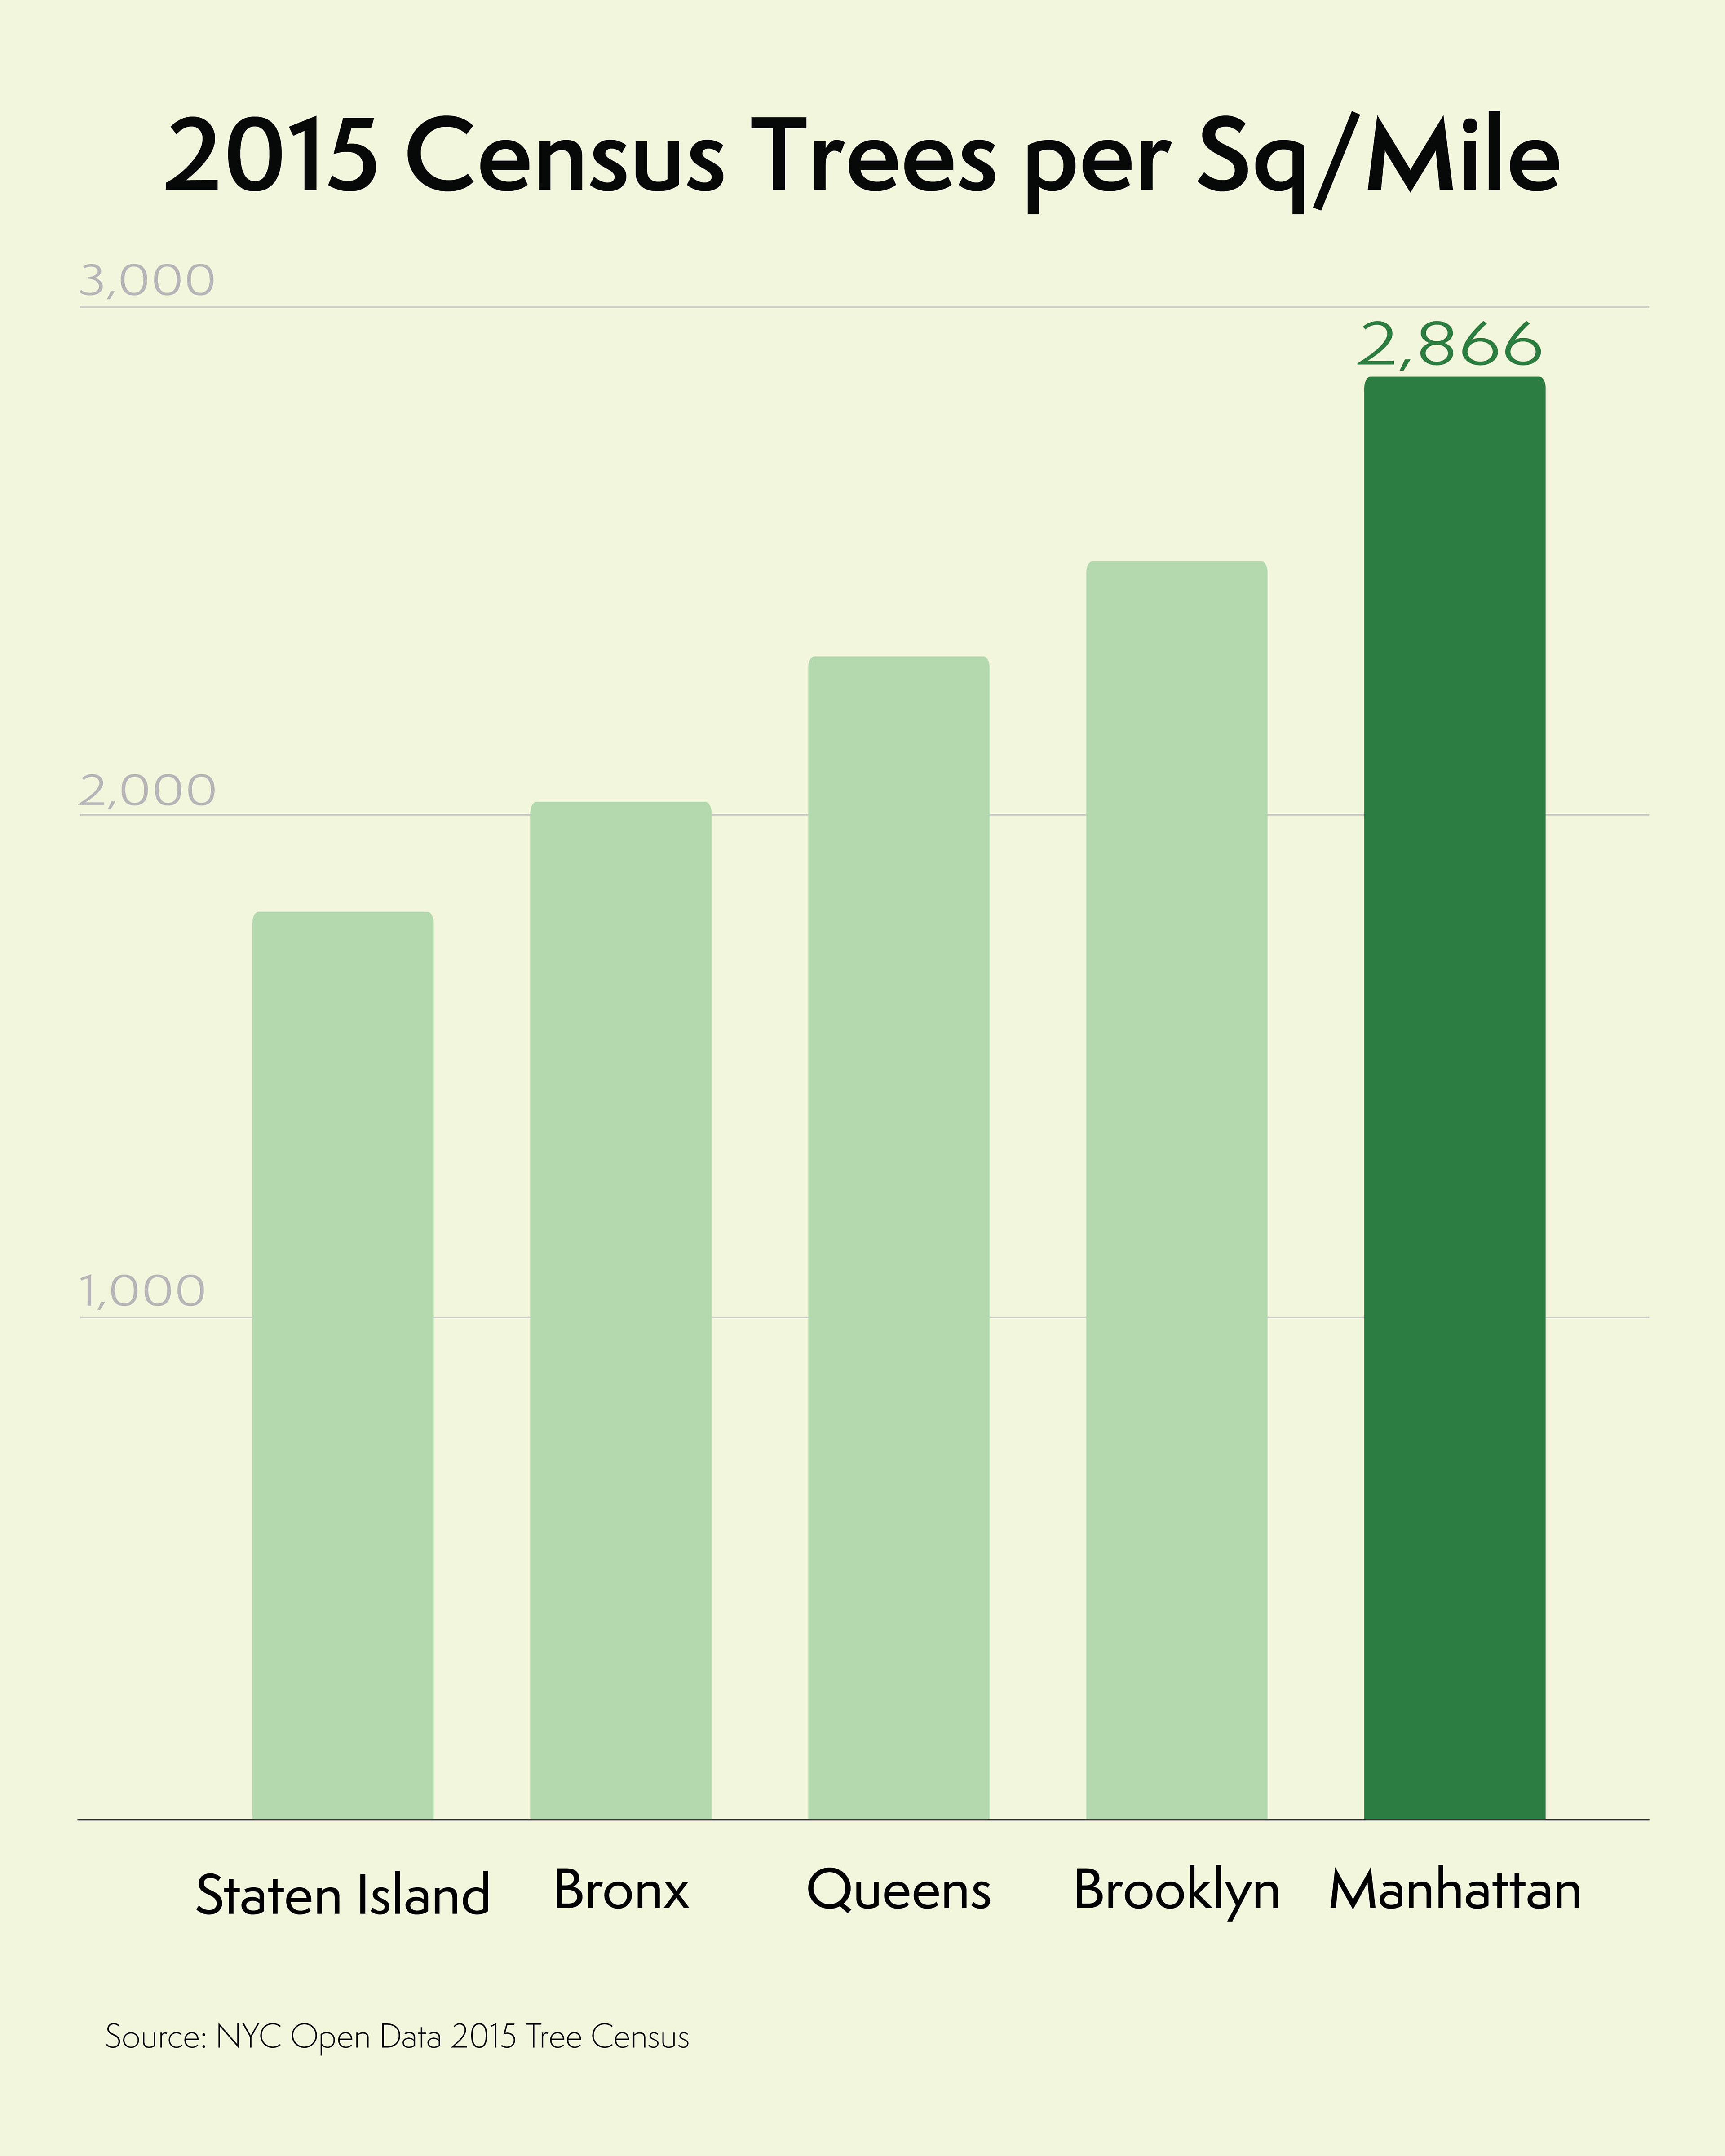
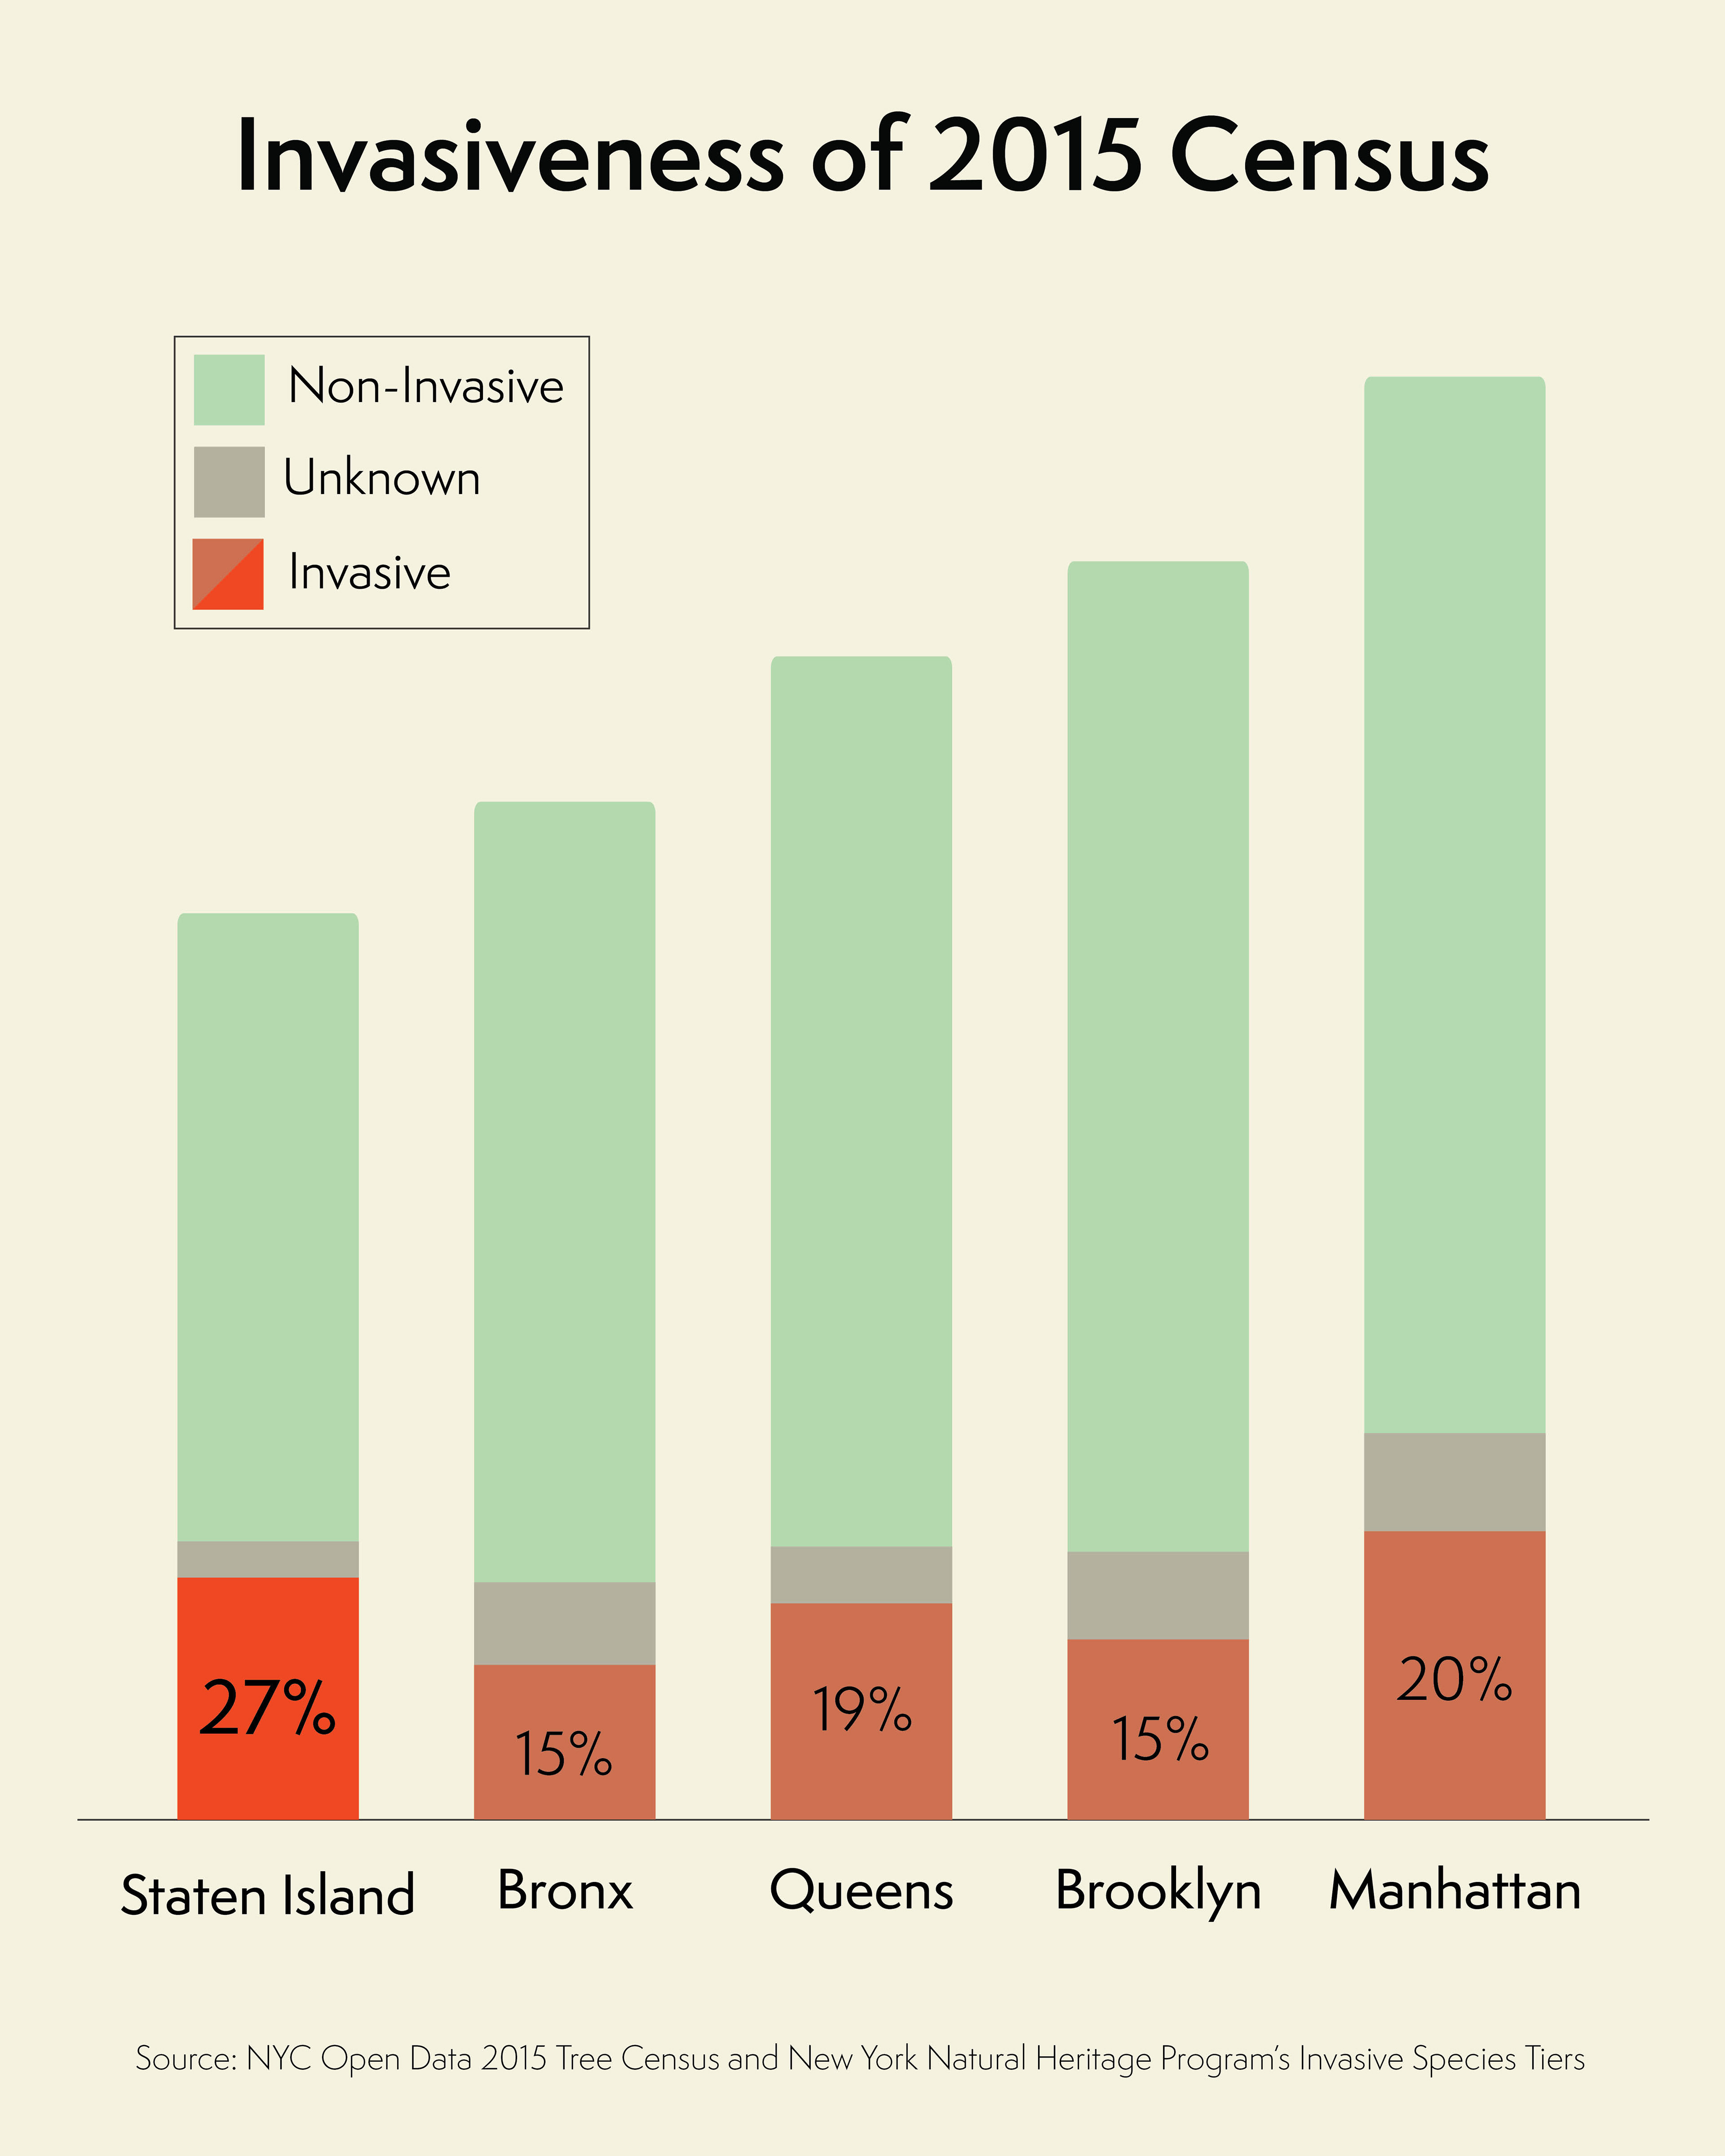
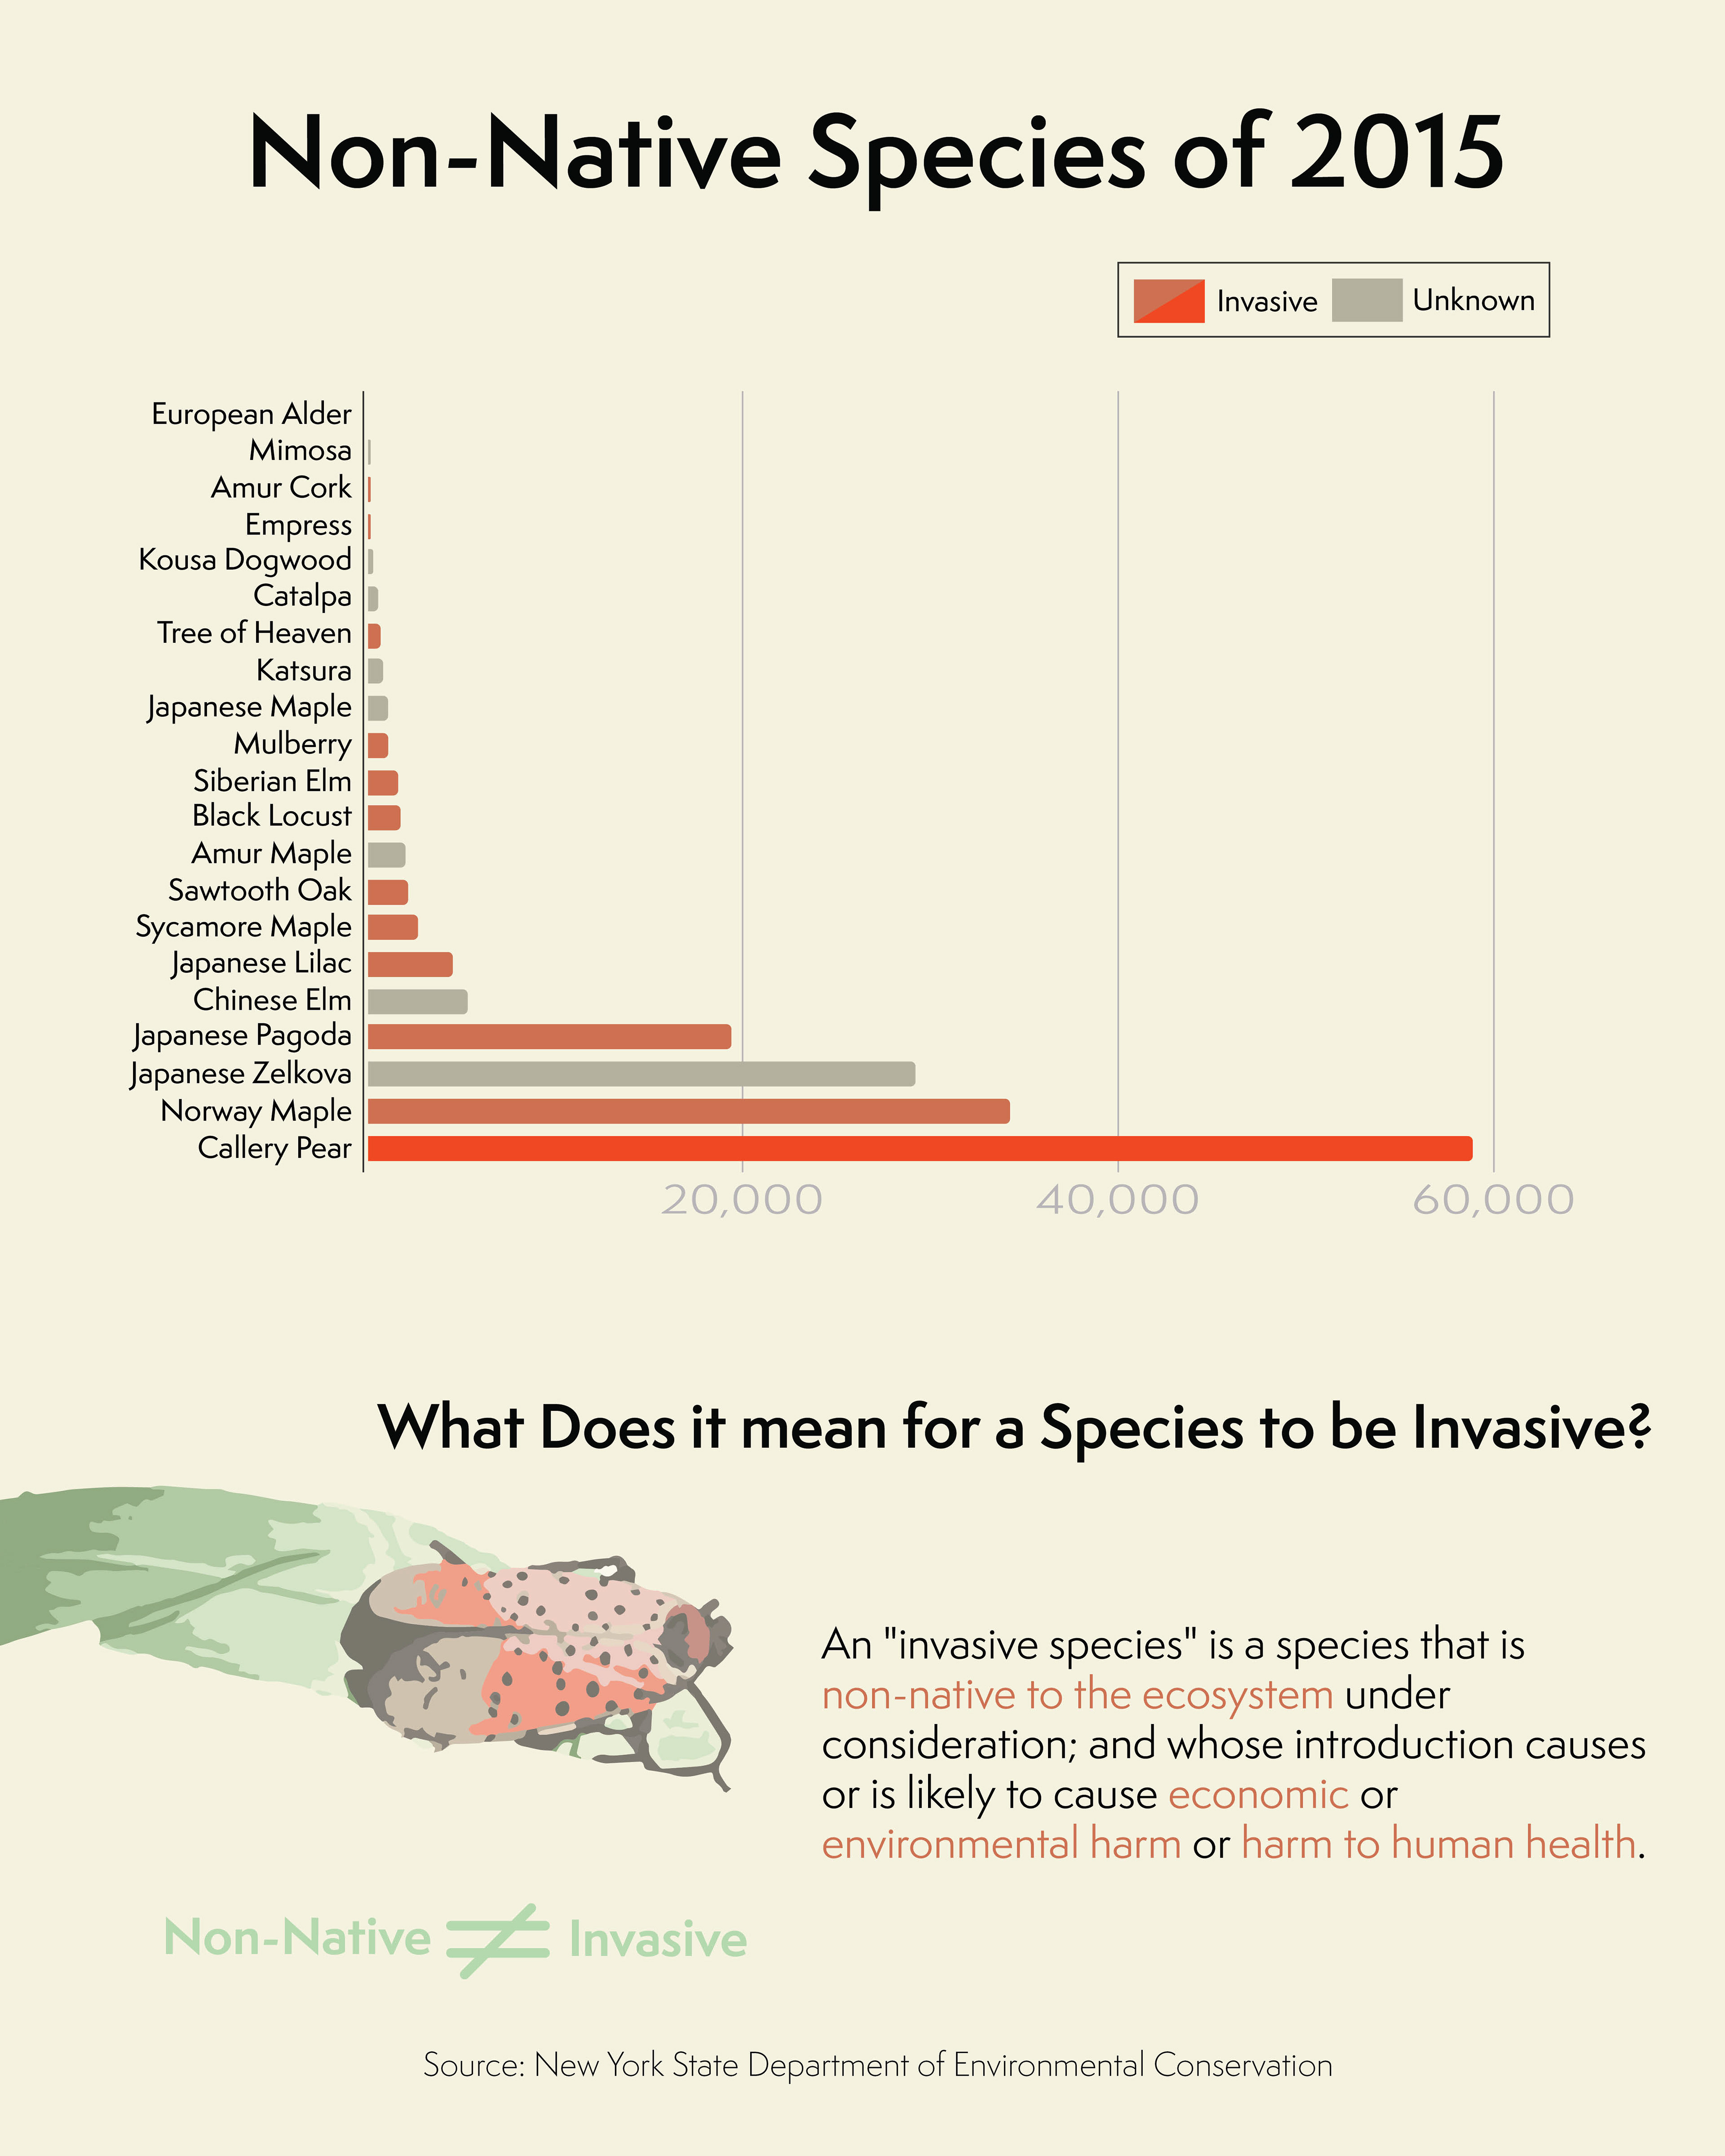
Using the 1995, 2005, and 2015 NYC Streets Tree Census data sets, I created a data story about the invasiveness of non-native street trees in NYC. The datasets include the species, size, and more of every tree located on the streets of NYC. My analysis is based on the species of the trees and the amount of each recorded. I utilized applications like ArcGIS, Microsoft Excel, Adobe Illustrator, and Adobe Photoshop to map by borough, species, invasiveness, and potential forecasting for the upcoming 2025 Street Tree Census.
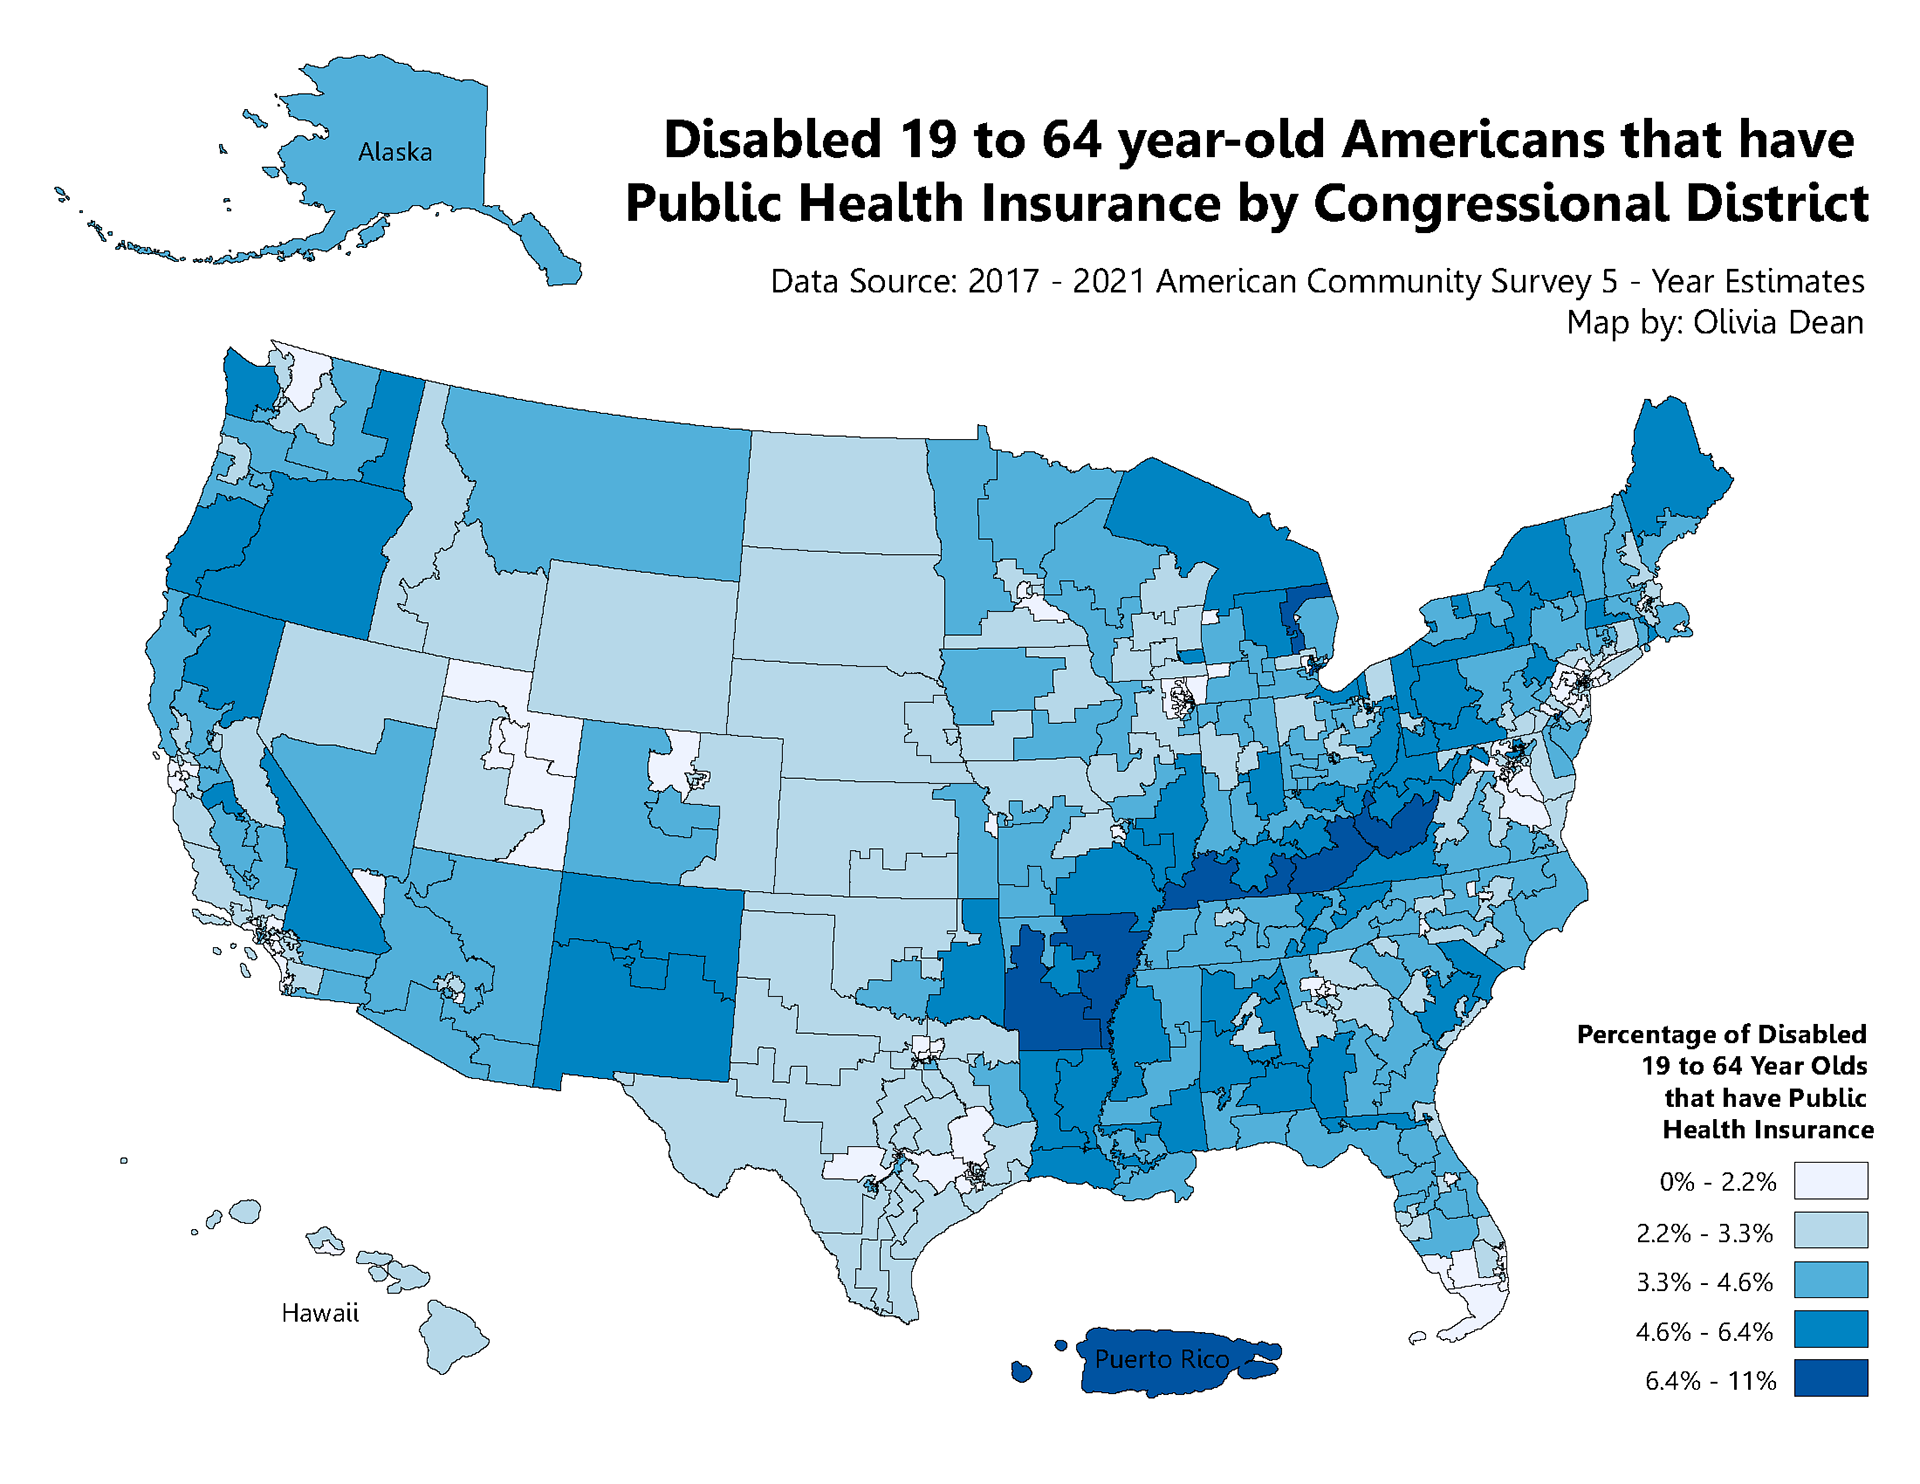
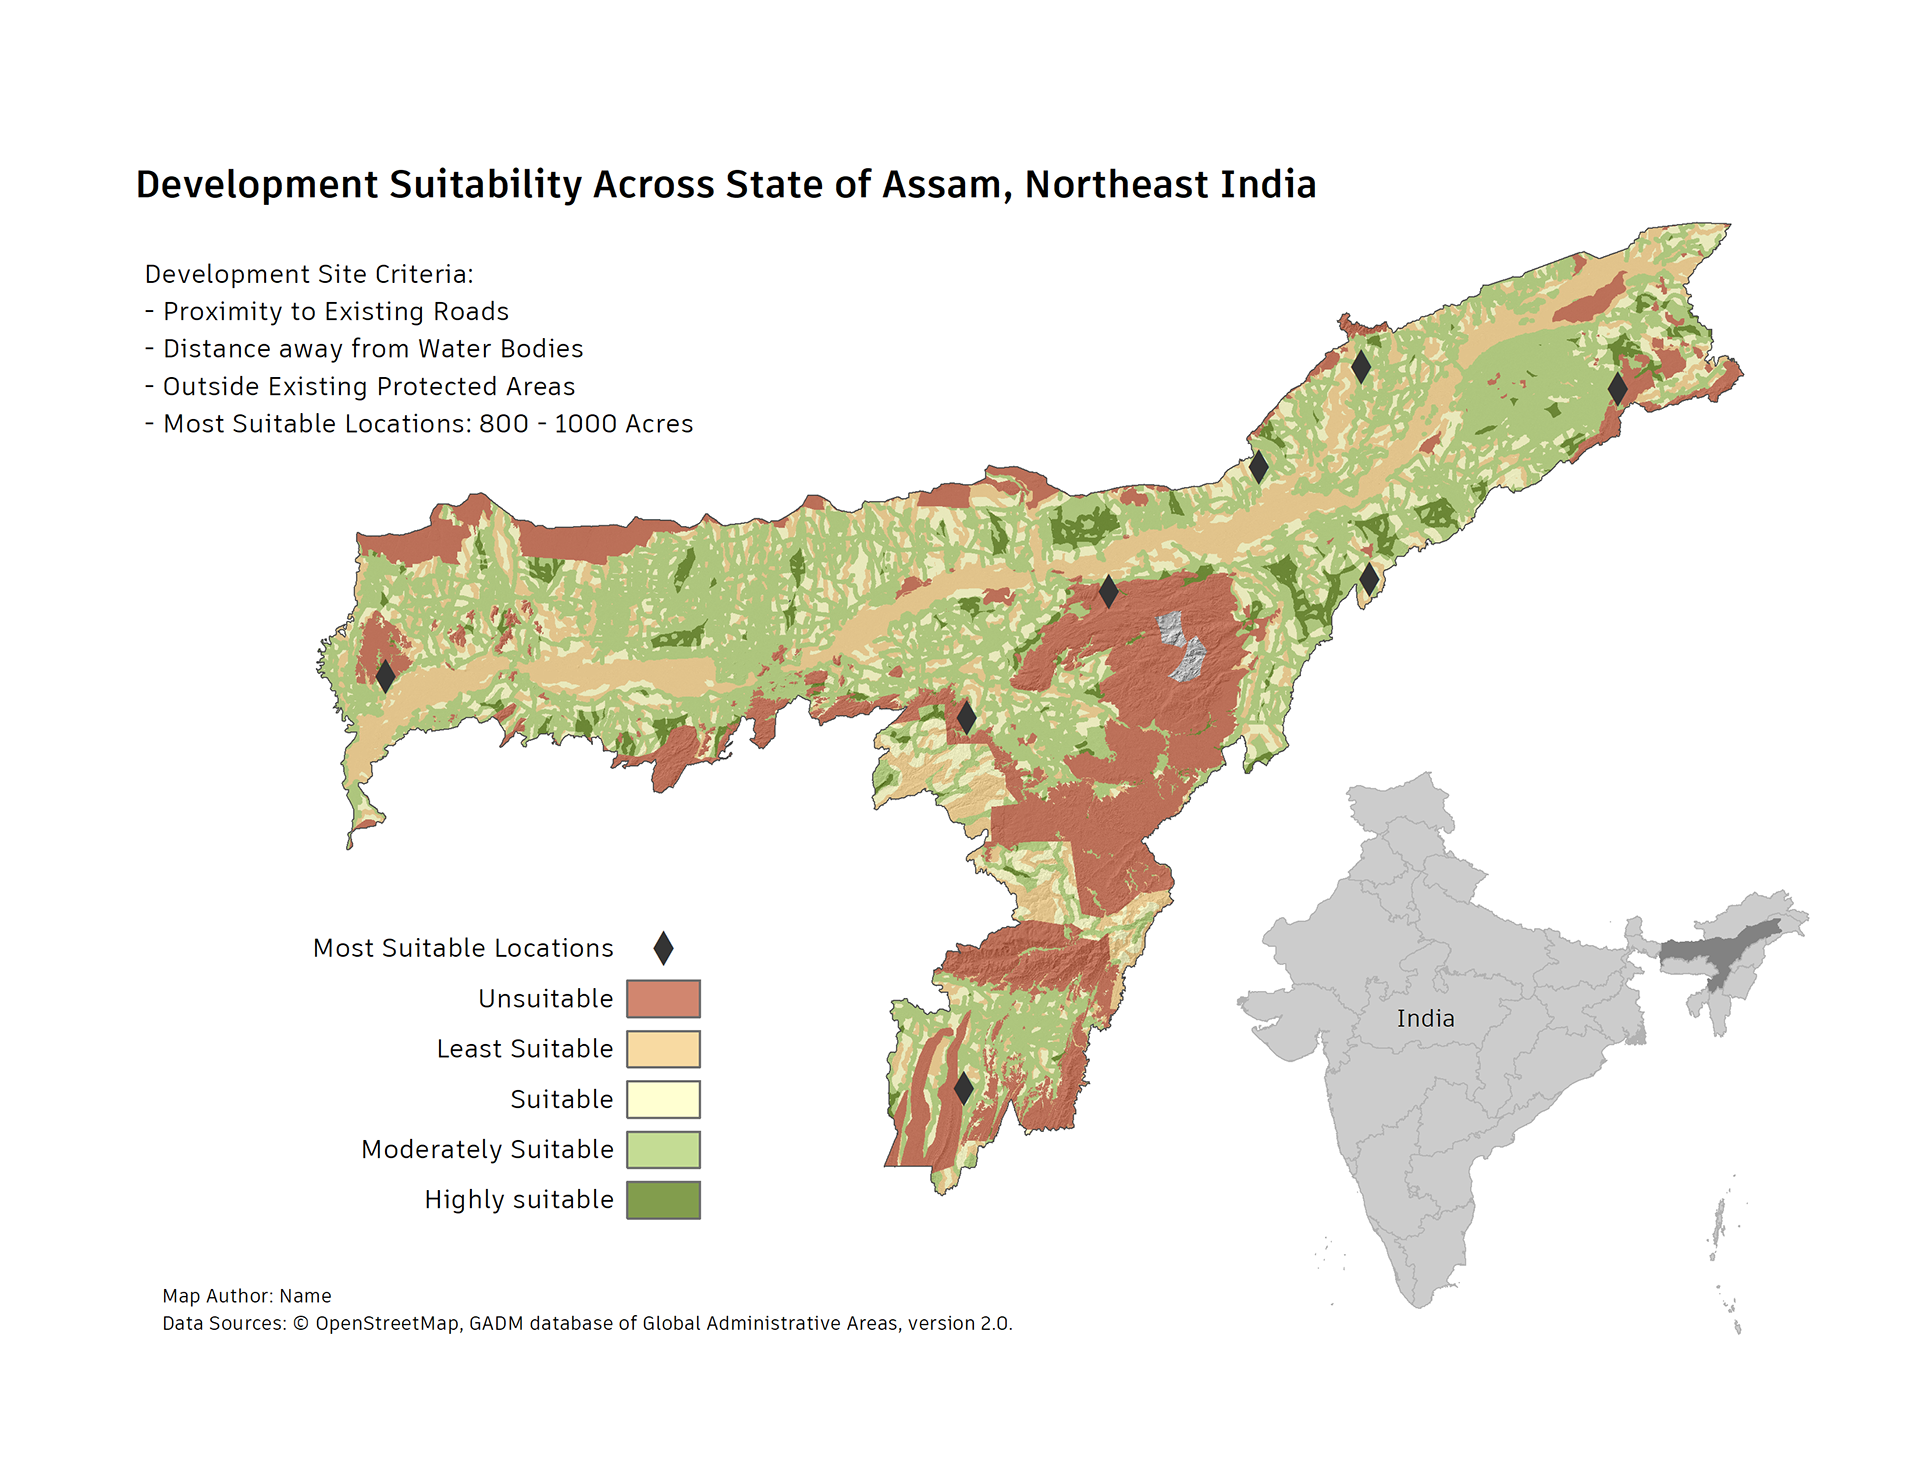
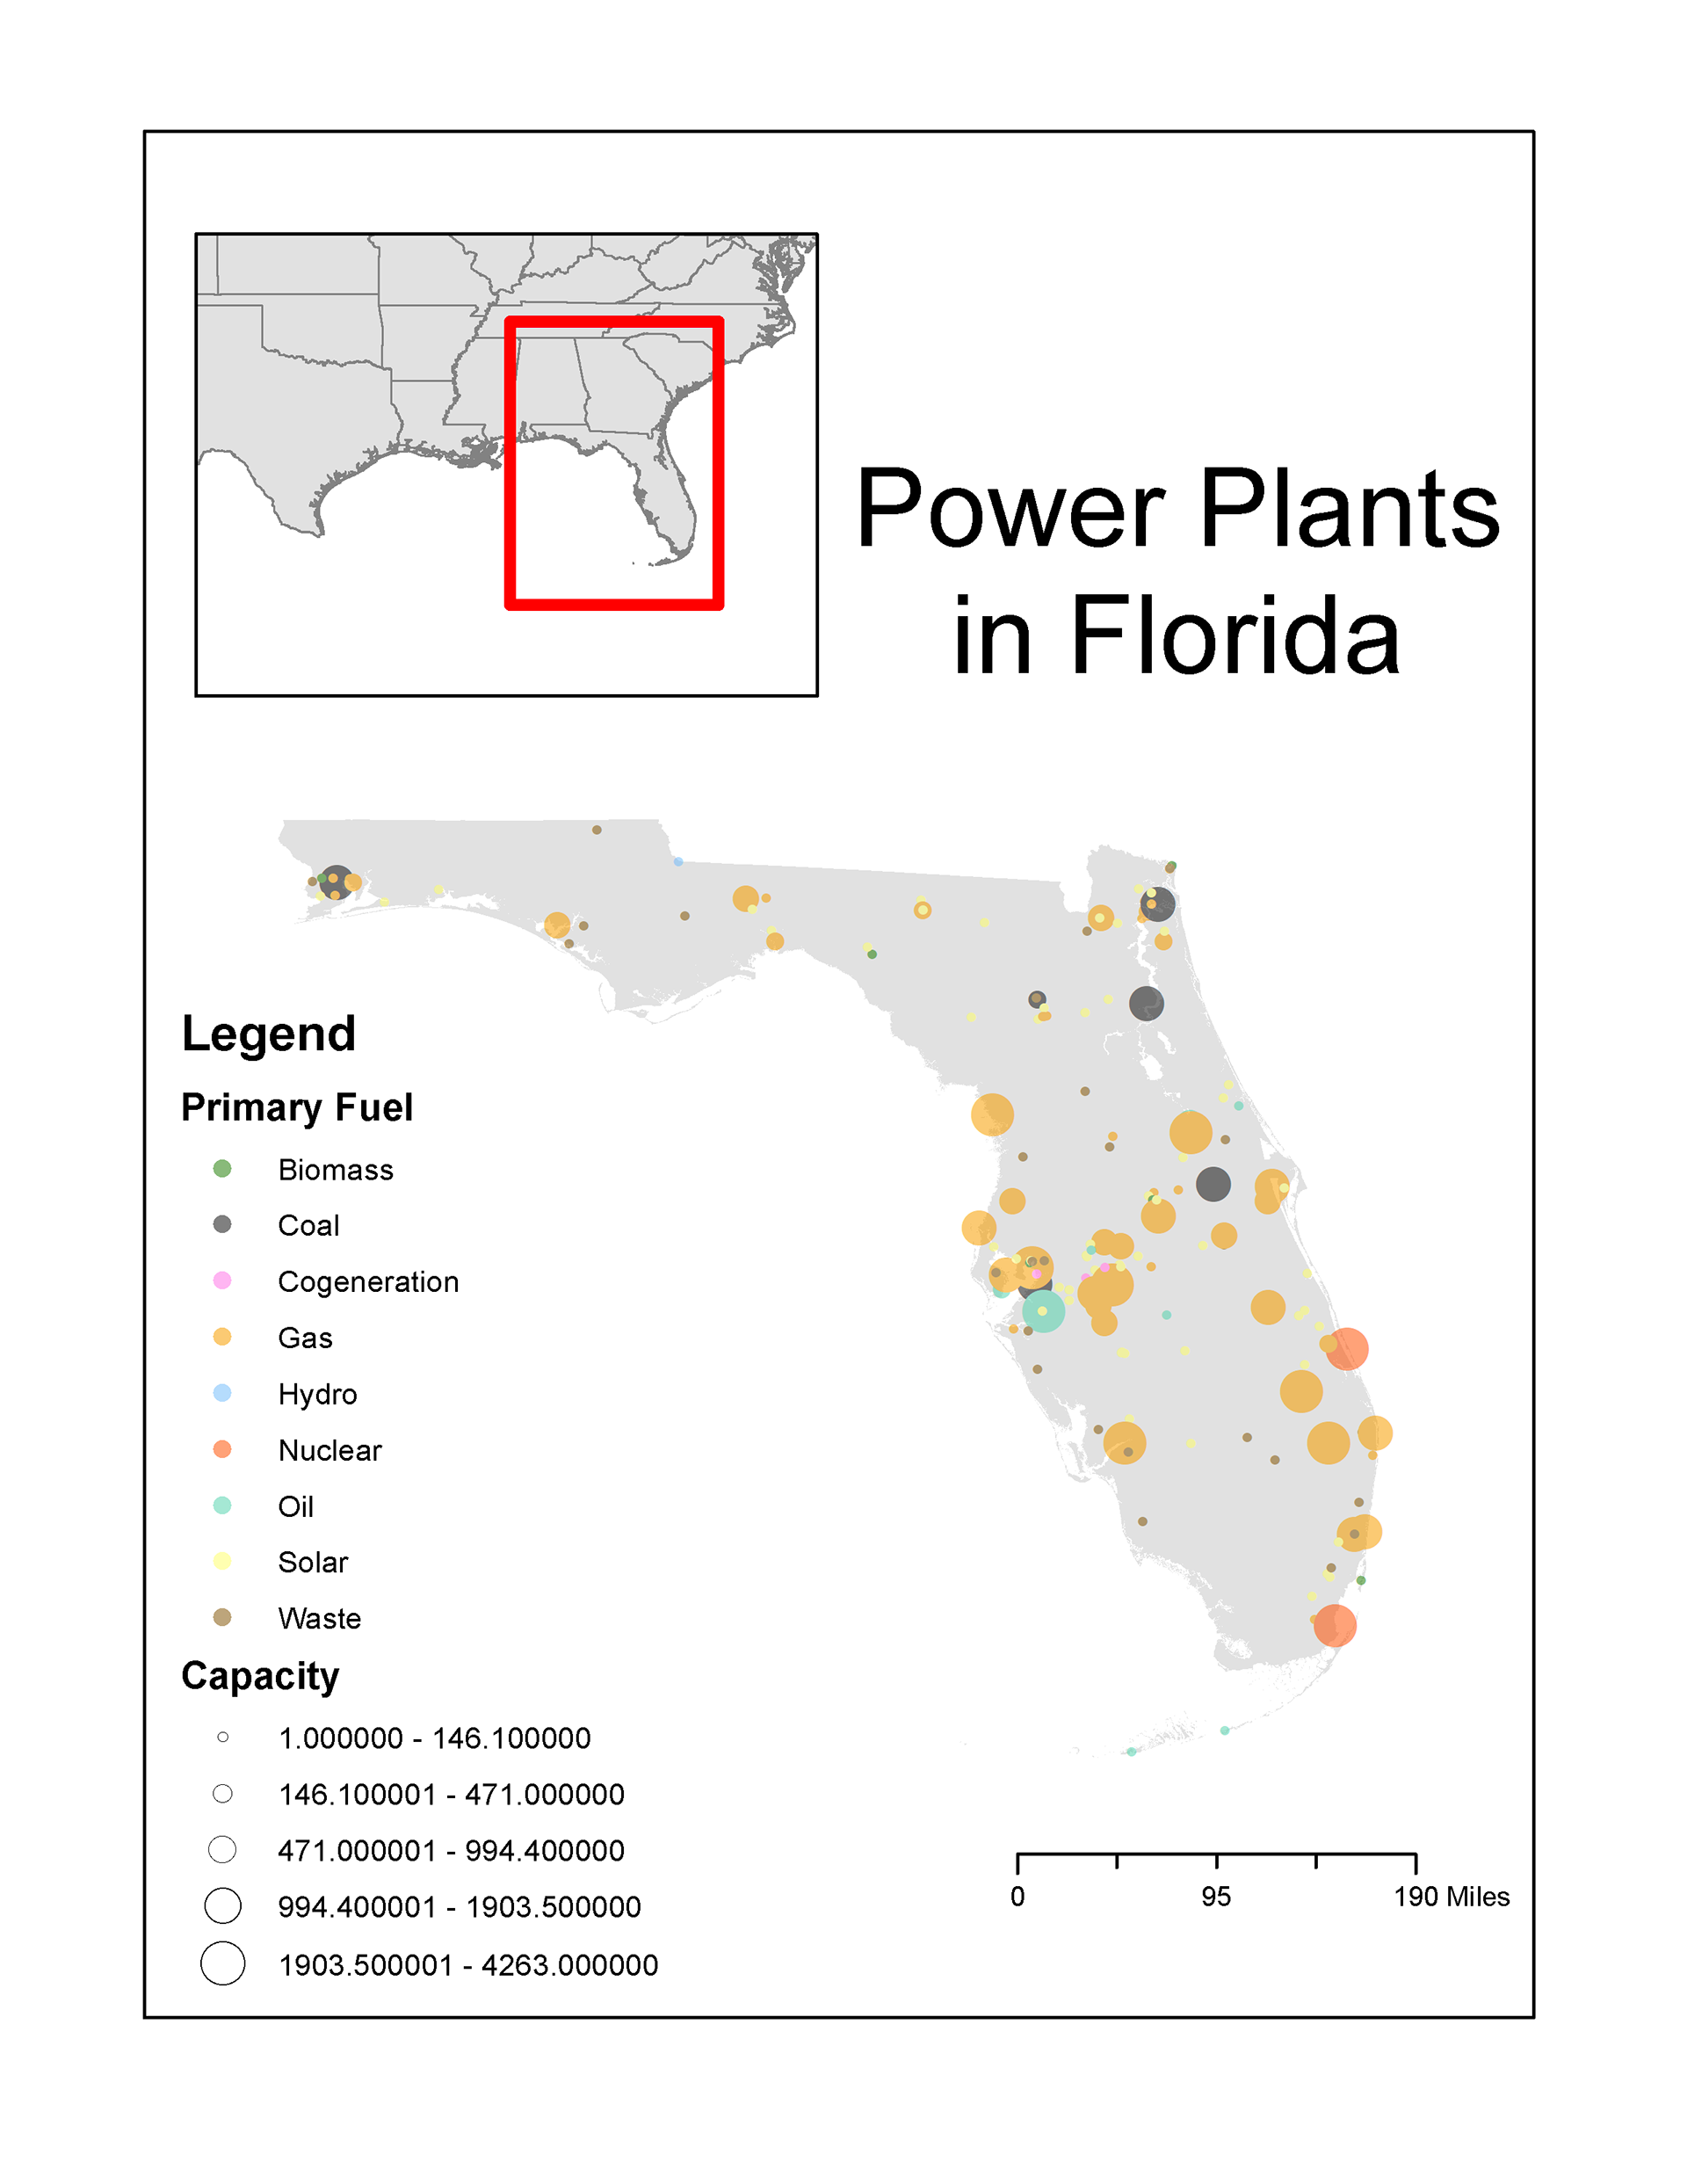
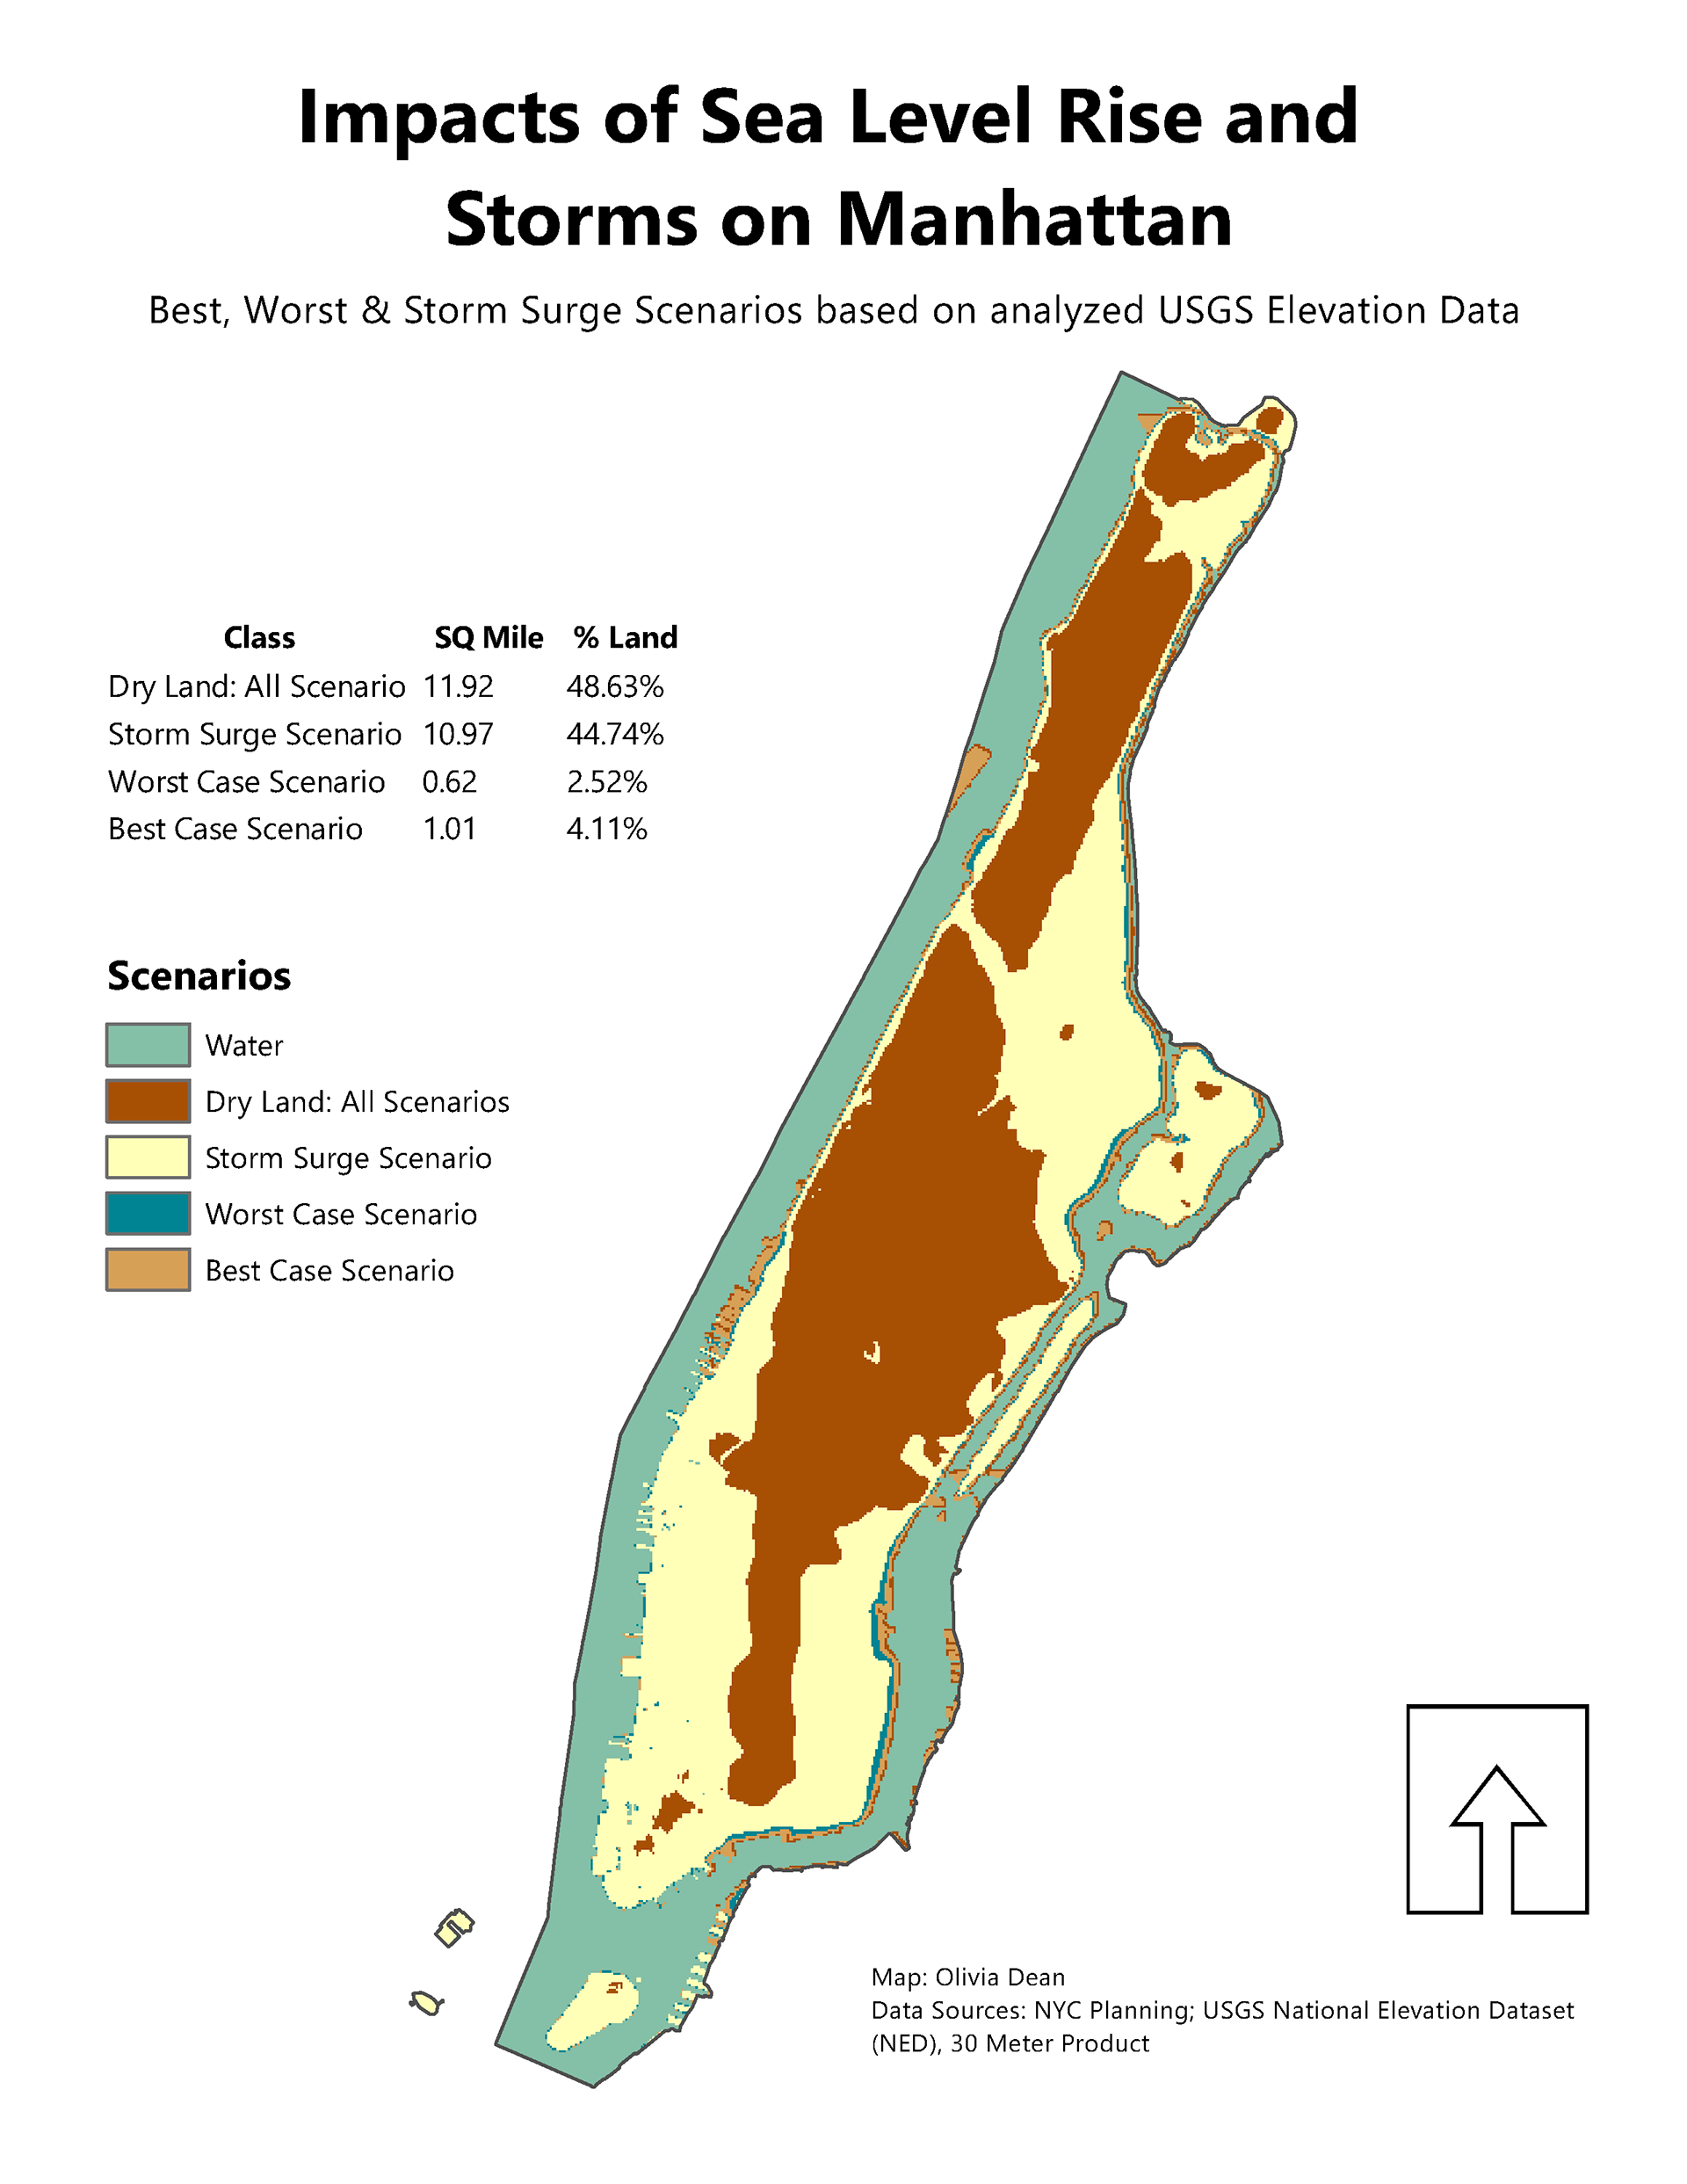
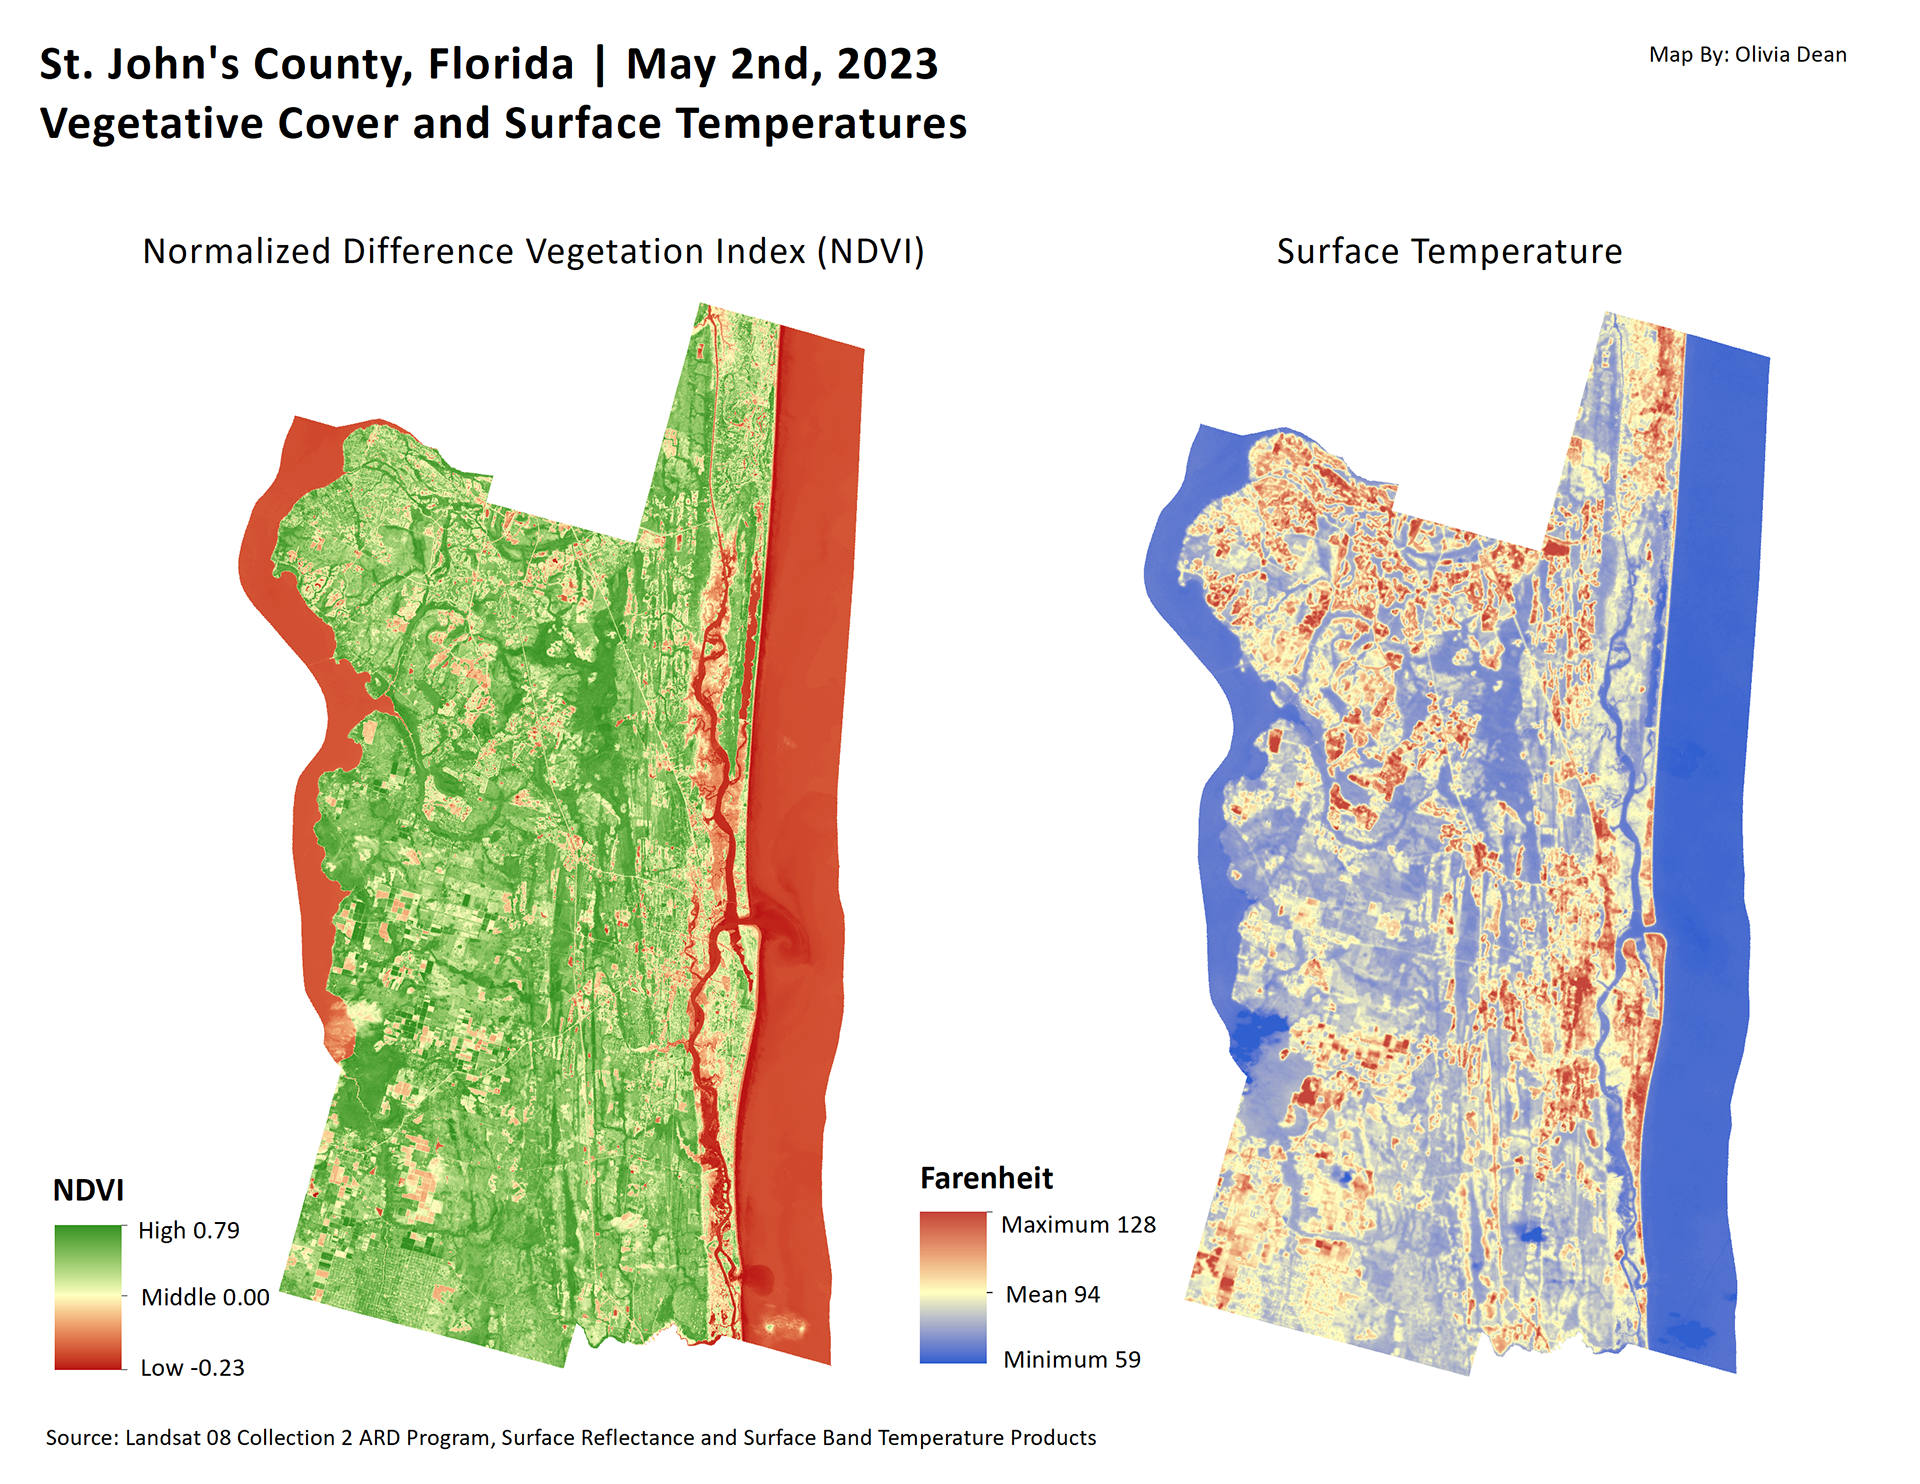
Spatial Thinking with ArcGIS
Exploring a Large Scale Data Visualization Program
During my junior year of college, I had the privilege to take a course called Spatial Thinking with ArcGIS for my Environmental Studies minor. In our weekly assignments, we learned to how to utilize the ArcGIS program to visualize large amounts of publicly accessible data into both raster and vector images. Topics we covered included cartographic principles, remote sensing, and more.