page 2-3
page 4-5
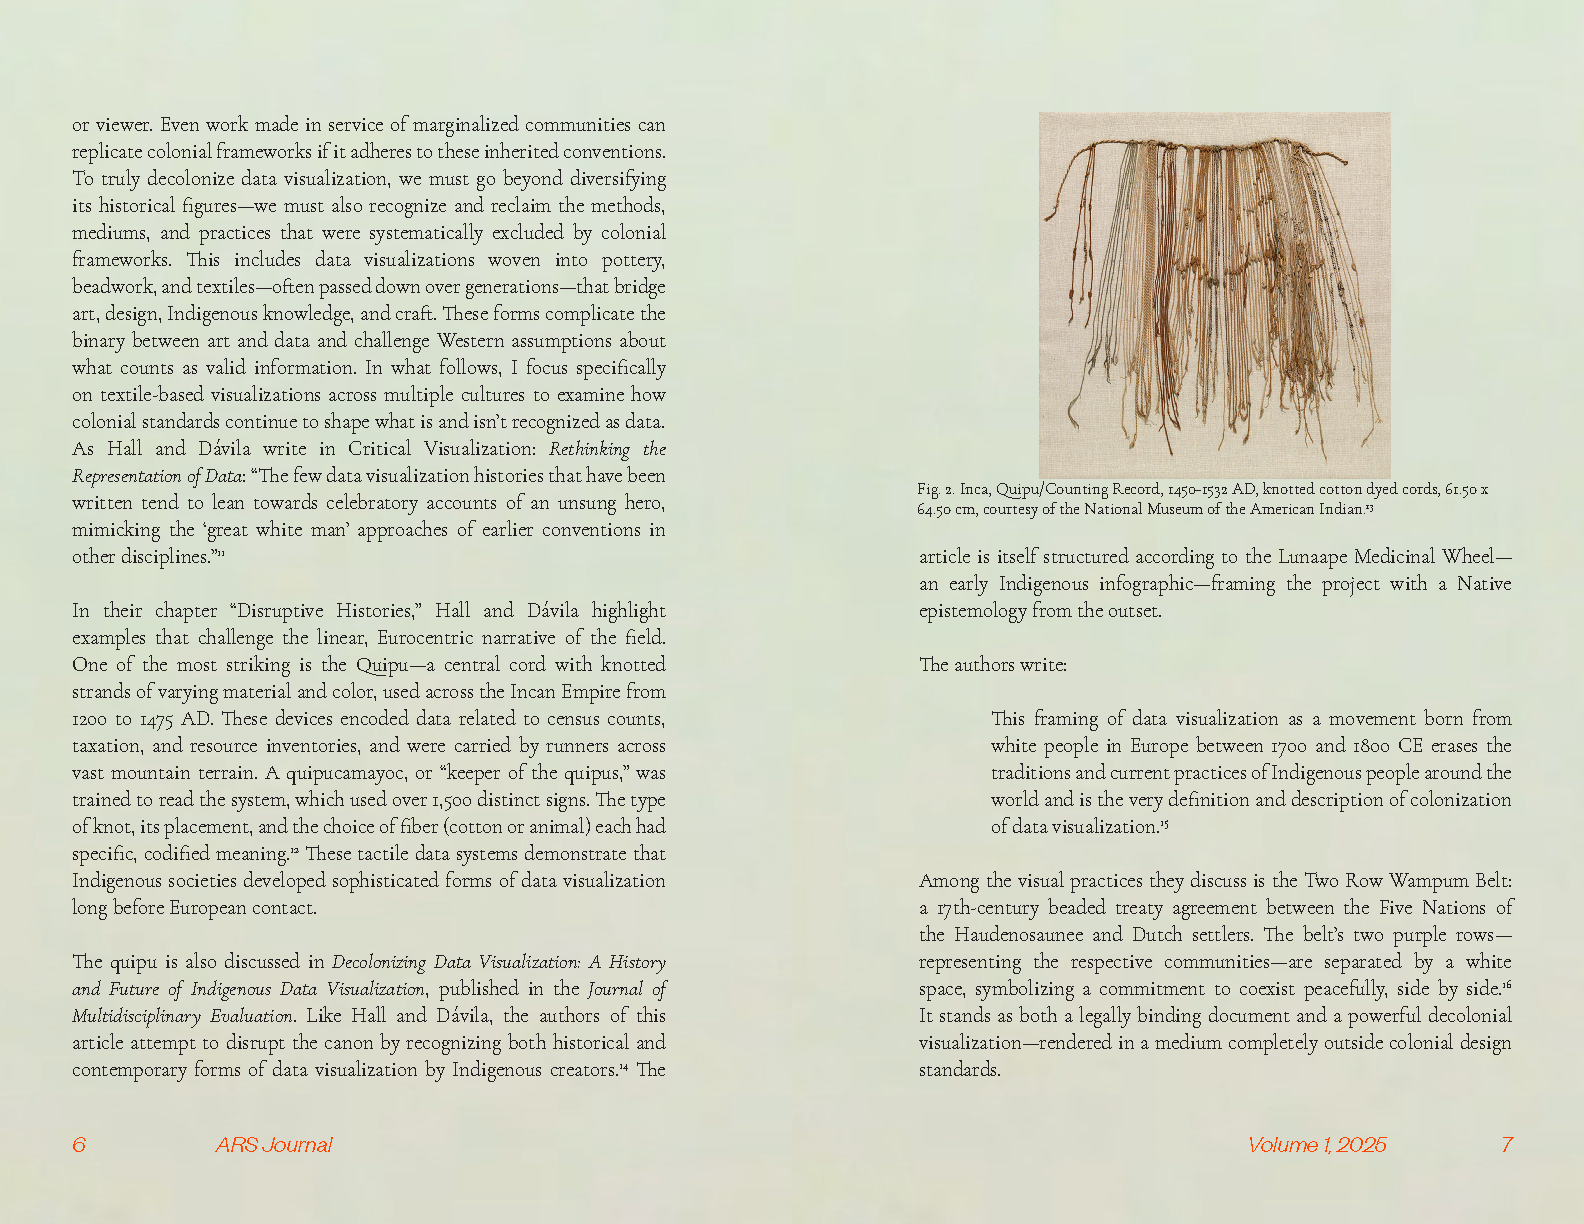
page 6-7
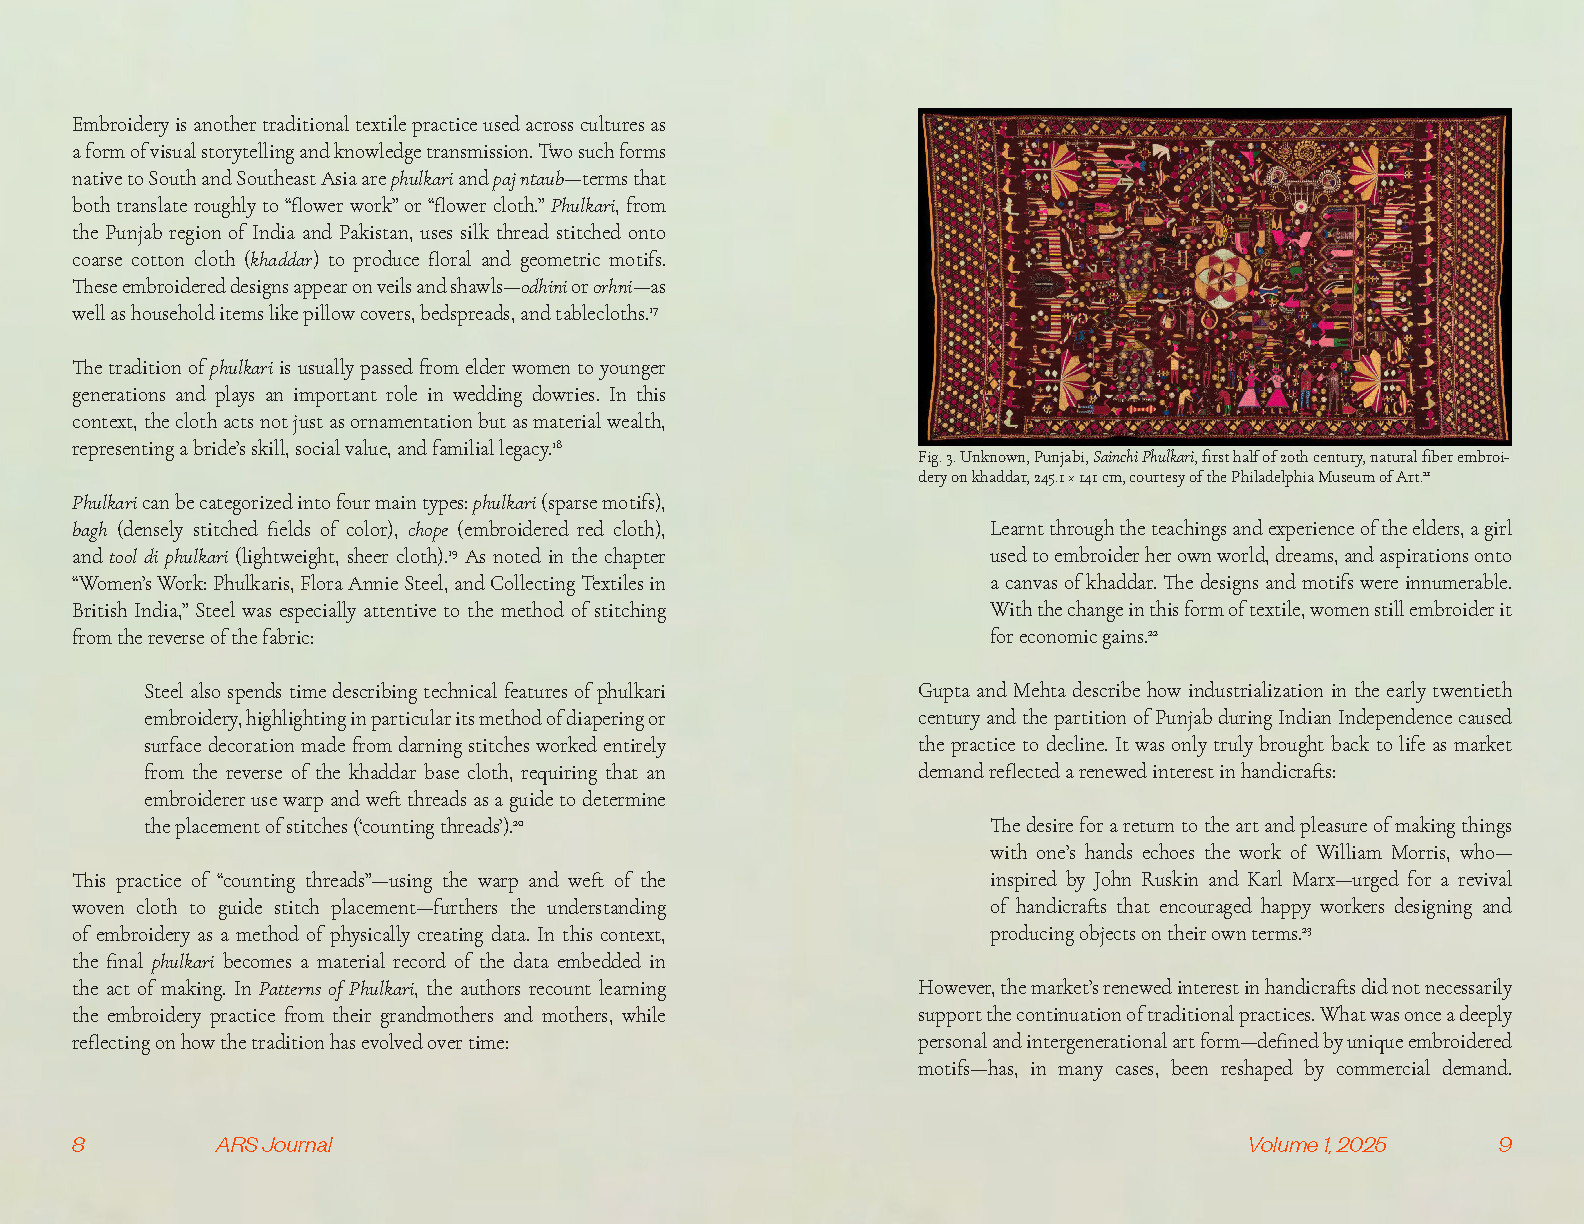
page 8-9
In my senior year of college I took a course called Advanced Research Seminar: Visual Culture. This course acted as our advanced research and writing course required for earning my BFA. The research done within the course resulted in a 5000 word essay on our chosen topics, likely one related to each of our program-specific thesis projects. My chosen topic was on the link between data visualization and textiles throughout history. After completing the essay and the course, my work was selected to be published in Volume 1 of The Advanced Research Seminar Journal. "This inaugural issue of the ARS Journal and Zine Series marks the beginning of a new platform for student research at The New School—a dual-format project designed to honor the range, rigor, and experimentation that defines their academic work," as Editor Timo Kuzme said in their opening letter. I am so thrilled to have my work be part of this inaugural issue.
Abstract for Seeing Threads:
The definition of ‘data visualization’ may vary depending on who you ask but most think of it as a graph, chart, or something similar that visualizes data or information. This definition is rooted in how popularly regarded historical retellings of data visualization, like those of Howard Funkhouser and Michael Friendly, credit the creation of it to mainly white European and American men. Recent retellings often include more diverse contributors like Florence Nightingale or W.E.B. Du Bois in the historical canon, and while this is necessary, the inclusion of simply non-white contributors does not go far enough to accurately represent the field’s history. What each of these visualizers continue to have in common with the well-regarded ones, is that they continue to use the same mediums and methods of the former. When their work is exhibited without much connection to cultural influences on choice of color or style, it requires that the audience be literate and therefore of a certain status to be able to understand it. In continuing to stick to these standards in the data visualization field, the newly accredited visualizers continue to uphold the standards that were put in place by the same Eurocentric men who misrepresented the history in the first place. To truly represent this history, we must break out of the standards that they set. The first step to doing this is through investigating other mediums, and one that has played a key role in the development of data visualization is that of textile practices. This article discusses significant examples of data visualization in textiles throughout the Native Americas, the Punjab region, Palestine, and southern China. The works demonstrate how broadening creative freedom in the field will help in the recognition of textile based and indigenous practices as a fundamental component of the history of data visualization.